by CalculatedRisk on 2/22/2012 04:52:00 PM
Wednesday, February 22, 2012
FNC House Prices, Zillow's forecast for Case-Shiller
Note: The Case-Shiller House Price index for December will be released Tuesday, Feb 28th. CoreLogic has already reported that prices declined 1.4% in December (NSA, including foreclosures). It appears that the Case-Shiller indexes (both SA and NSA) were at new post-bubble lows in December.
• Today from FNC: December Residential Property Values Decline 0.7%
Based on the latest data on non-distressed home sales (existing and new homes) through December, FNC’s national RPI shows that single-family home prices fell in December to a seasonally unadjusted rate of 0.7%. ... As a gauge of underlying home value, the RPI excludes sales of foreclosed homes, which are frequently sold with large price discounts reflecting poor property conditions.The FNC index tables for four composite indexes and 30 cities are here.
...
All three RPI composites (the National, 30-MSA, and 10-MSA indices) show month-to-month declines in December, ranging from -0.7% at the national level to -1.1% in the nation’s top 10 housing markets.
The indices’ year-to-year trends generally show the pace of price declines slowing. The national RPI indicates that December home prices declined at a seasonally adjusted rate of 3.5%, the smallest year-to-year declines since May 2010 when home prices rebounded under the federal homebuyer tax credits program. The year-to-year declines at the nation’s top housing markets, as indicated by the 30- and 10-MSA composites, have also decelerated to their slowest pace.
• Zillow Forecast: Zillow Forecast: December Case-Shiller Composite-20 Expected to Show 4.0% Decline from One Year Ago
Zillow predicts that the 20-City Composite Home Price Index (non-seasonally adjusted [NSA]) will decline by 4.0 percent on a year-over-year basis, while the 10-City Composite Home Price Index (NSA) will decline by 3.9 percent. The seasonally adjusted (SA) month-over-month change from November to December will be -0.5 percent and -0.6 percent for the 20 and 10-City Composite Home Price Index (SA), respectively.Case-Shiller will probably report house prices were at a new post-bubble lows in December for both the seasonally adjusted (SA) index and the Not Seasonally Adjusted (NSA) index.
| Case Shiller Composite 10 | Case Shiller Composite 20 | ||||
|---|---|---|---|---|---|
| NSA | SA | NSA | SA | ||
| Case Shiller (actual) | December 2010 | 156.04 | 155.91 | 142.39 | 142.32 |
| November 2011 | 151.9 | 150.89 | 138.49 | 137.52 | |
| Zillow December Forecast | YoY | -3.9% | -3.9% | -4.0% | -4.0% |
| MoM | -1.3% | -0.6% | -1.3% | -0.5% | |
| Zillow Forecasts1 | 150 | 149.9 | 136.7 | 136.7 | |
| Post Bubble Lows | 150.44 | 150.89 | 137.64 | 137.52 | |
| Date of Low | April 2009 | November 2011 | March 2011 | November 2011 | |
| 1Estimate based on Year-over-year and Month-over-month Zillow forecasts | |||||
AIA: Architecture Billings Index indicated expansion in January
by CalculatedRisk on 2/22/2012 01:48:00 PM
Note: This index is a leading indicator for new Commercial Real Estate (CRE) investment.
From AIA: Architecture Billings Index Remains Positive for Third Straight Month
On the heels of consecutive months of strengthening business conditions, the Architecture Billings Index (ABI) has now reached positive territory three months in a row. As a leading economic indicator of construction activity, the ABI reflects the approximate nine to twelve month lag time between architecture billings and construction spending. The American Institute of Architects (AIA) reported the January ABI score was 50.9, following a mark of 51.0 in December. This score reflects a slight increase in demand for design services (any score above 50 indicates an increase in billings). The new projects inquiry index was 61.2, down just a notch from a reading of 61.5 the previous month.
“Even though we had a similar upturn in design billings in late 2010 and early 2011, this recent showing is encouraging because it is being reflected across most regions of the country and across the major construction sectors,” said AIA Chief Economist, Kermit Baker, PhD, Hon. AIA. “But because we still continue to hear about struggling firms and some continued uncertainty in the market, we expect overall economic improvements in the design and construction sector to be modest in the coming months.”
 Click on graph for larger image.
This graph shows the Architecture Billings Index since 1996. The index was at 50.9 in January (slight expansion). Anything above 50 indicates expansion in demand for architects' services.
Note: This includes commercial and industrial facilities like hotels and office buildings, multi-family residential, as well as schools, hospitals and other institutions.
According to the AIA, there is an "approximate nine to twelve month lag time between architecture billings and construction spending" on non-residential construction. So this suggests further declines in CRE investment in early 2012, but perhaps stabilizing later in 2012.
Existing Home Sales: Inventory and NSA Sales Graph
by CalculatedRisk on 2/22/2012 11:54:00 AM
First a comment from Michelle Meyer and Ethan Harris at Merrill Lynch:
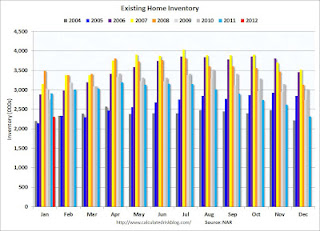
One of the most encouraging aspects of the report was the continued drop in inventory. The number of homes on the market for sale fell further in January after plunging 11.5% in December. This has left inventory almost 21% below the level last January. Combined with the recent gain in home sales, months supply has tumbled to 6.1 months, the lowest since April 2006. However, we expect this to be a temporary cyclical low. Part of the drop in inventory reflects delays in the foreclosure process which has slowed the flow of distressed properties into the market. We think the foreclosure process will accelerate, which will speed up the flow of distressed inventory. We expect supply to edge back to 8 months this year.The NAR reported inventory fell to 2.31 million in January. This is down 20.6% from January 2011, and this is about 8% above the inventory level in January 2005 (mid-2005 was when inventory started increasing sharply). This decline in inventory was a significant story in 2011.
The following graph shows inventory by month since 2004. In 2005 (dark blue columns), inventory kept rising all year - and that was a clear sign that the housing bubble was ending.
 Click on graph for larger image.
This year (dark red for January) inventory is at the lowest level for a January since 2005. Inventory is still elevated - especially with the much lower sales rate - but lower inventory levels put less downward pressure on house prices (of course the level of distressed properties is still very high, and there is a significant shadow inventory).
Part of the reason inventory has fallen is because there are fewer foreclosures listed for sale. Merrill Lynch analysts think supply will edge back up to 8 months-of-supply as the lenders increase foreclosure activity.
There is also a seasonal pattern. Inventory usually starts increasing in February and March, and peaks in July and August. The seasonal increase in inventory will be something to watch this spring and summer, but the Merrill forecast would mean that inventory increases to over 3 million units this summer (assuming sales at the current rate). I don't think we will see inventory that high.
The following graph shows existing home sales Not Seasonally Adjusted (NSA).
 Sales NSA (red column) are slightly above the sales for the last four years (2008 through 2011), but well below the bubble years of 2005 and 2006.
The level of sales is still elevated due to investor buying. The NAR noted:
All-cash sales were unchanged at 31 percent in January; they were 32 percent in January 2011. Investors account for the bulk of cash transactions.Earlier:
Investors purchased 23 percent of homes in January, up from 21 percent in December; they were 23 percent in January 2011.
• Existing Home Sales in January: 4.57 million SAAR, 6.1 months of supply
• Existing Home Sales graphs
Existing Home Sales in January: 4.57 million SAAR, 6.1 months of supply
by CalculatedRisk on 2/22/2012 10:00:00 AM
The NAR reports: Existing-Home Sales Rise Again in January, Inventory Down
Total existing-home sales, which are completed transactions that include single-family homes, townhomes, condominiums and co-ops, increased 4.3 percent to a seasonally adjusted annual rate of 4.57 million in January from a downwardly revised 4.38 million-unit pace in December and are 0.7 percent above a spike to 4.54 million in January 2011.
...
Total housing inventory at the end of January fell 0.4 percent to 2.31 million existing homes available for sale, which represents a 6.1-month supply at the current sales pace, down from a 6.4-month supply in December.
 Click on graph for larger image.
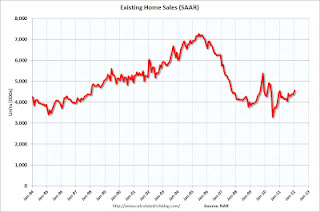
This graph shows existing home sales, on a Seasonally Adjusted Annual Rate (SAAR) basis since 1993.
Sales in January 2012 (4.57 million SAAR) were 4.3% higher than last month, and were 0.7% above the January 2011 rate.
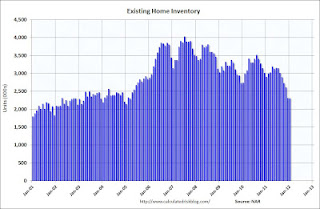
 The second graph shows nationwide inventory for existing homes.
According to the NAR, inventory decreased to 2.31 million in January from 2.32 million in December. This is the lowest level of inventory since March 2005.
The last graph shows the year-over-year (YoY) change in reported existing home inventory and months-of-supply. Since inventory is not seasonally adjusted, it really helps to look at the YoY change. Note: Months-of-supply is based on the seasonally adjusted sales and not seasonally adjusted inventory.
 Inventory decreased 20.6% year-over-year in January from January 2011. This is the eleventh consecutive month with a YoY decrease in inventory.
Months of supply decreased to 6.1 months in January, down from 6.4 months in December.
MBA: Purchase Applications Decrease in Latest Weekly Survey
by CalculatedRisk on 2/22/2012 08:21:00 AM
From the MBA: Mortgage Applications Decrease in Latest MBA Weekly Survey
The Refinance Index decreased 4.8 percent from the previous week. The seasonally adjusted Purchase Index decreased 2.9 percent from one week earlier.The purchase index is still moving sideways at a very low level.
The average contract interest rate for 30-year fixed-rate mortgages with conforming loan balances ($417,500 or less) increased to 4.09 percent from 4.08 percent ...
The average contract interest rate for 30-year fixed-rate mortgages with jumbo loan balances (greater than $417,500)increased to 4.32 percent from 4.30 percent ...


