
We’re all about storytelling — and there are countless stories to be told that can be discovered with data. At Stanford, you’ll learn how to use data to boost your multimedia reporting to the next level.
What You’ll Learn
BEAT REPORTING SKILLS

DATA FRAME OF MIND

MULTIMEDIA STORYTELLING
DSLR VIDEOGRAPHY

DATA NEGOTIATION, SCRAPING, CLEANING and ANALYSIS

INVESTIGATIVE REPORTING TECHNIQUES
BUILDING A NEWS APP
LOCALIZING A NATIONAL STORY

FEATURE STORYTELLING
Software and Platforms You’ll Gain Experience In:
- Final Cut Pro X
- Hindenburg Audio Editing
- GitHub
- Google Fusion Tables
- The command line
- Sublime Text Editor
- SQL
- Python
- R
- Advanced spreadsheet techniques
- Twitter API
- Tableau
- ArcGIS Mapping
- Tabula and data cleaning
- Adobe Photoshop
- Wordpress CMS
- Jekyll
- Social tools like Hootsuite
- Social media: Twitter, Facebook, Instagram
Courses
The Graduate Degree in Journalism requires a minimum of 45 units. In addition to seven required courses, students have to take two specialized writing courses, chosen from a list of eleven, and three approved electives from among graduate-level courses in the Department of Communication or from among courses across campus. We encourage students in the program to take courses outside of the department in everything from statistics to coding to design thinking.
Except for COMM 289P Journalism Master’s Thesis, all courses must be taken for a letter grade. To remain in good academic standing, students must maintain a grade point average (GPA) of 3.0 or better. Graduation requires a GPA of 3.0 or better.
Sample Schedule
Guest Speakers and Events
Working journalists and media industry pros are frequently invited to classes as guests to share their professional expertise and practical insights relevant to the challenges impacting the ever-changing media landscape. Recent guests have included Jill Abramson (former executive editor of The New York Times), Barton Gellman (Pulitzer Prize-winning journalist) and Simon Rogers (data editor at Google). Additionally, there are numerous events across the Stanford campus almost every day that bring prominent technology executives, entrepreneurs and journalists to speak.
The Stanford Journalism Program also has co-hosted conferences that have featured journalists from news organizations like Reuters, NPR, The New York Times, Florida Sun-Sentinel and MuckRock.
> “Data Driven: Coding and Writing Transportation’s Future”
> “Corruption: Who Plays? Who Pays?”
> “125 Years of Journalism at Stanford”
> “2016 Computation + Journalism Symposium”
Journalism Thesis Project
The Stanford Journalism Program provides a unique opportunity for students to showcase their talents as prospective authors and journalists. Each student will launch an intensive, in-depth inquiry into an area that he or she is personally interested in examining and critiquing at length. The MA Project represents a major commitment of time and effort. While there is no formal publishing requirement, the completed project must be judged by a member of the Journalism faculty to be of a quality acceptable for publication. Successful completion is a precondition for graduation from the program. MA Projects are typically launched during Winter Quarter with a deadline-driven submission date of the last day of class of Spring Quarter.
Student Media and Professional News Partnerships
Facilities
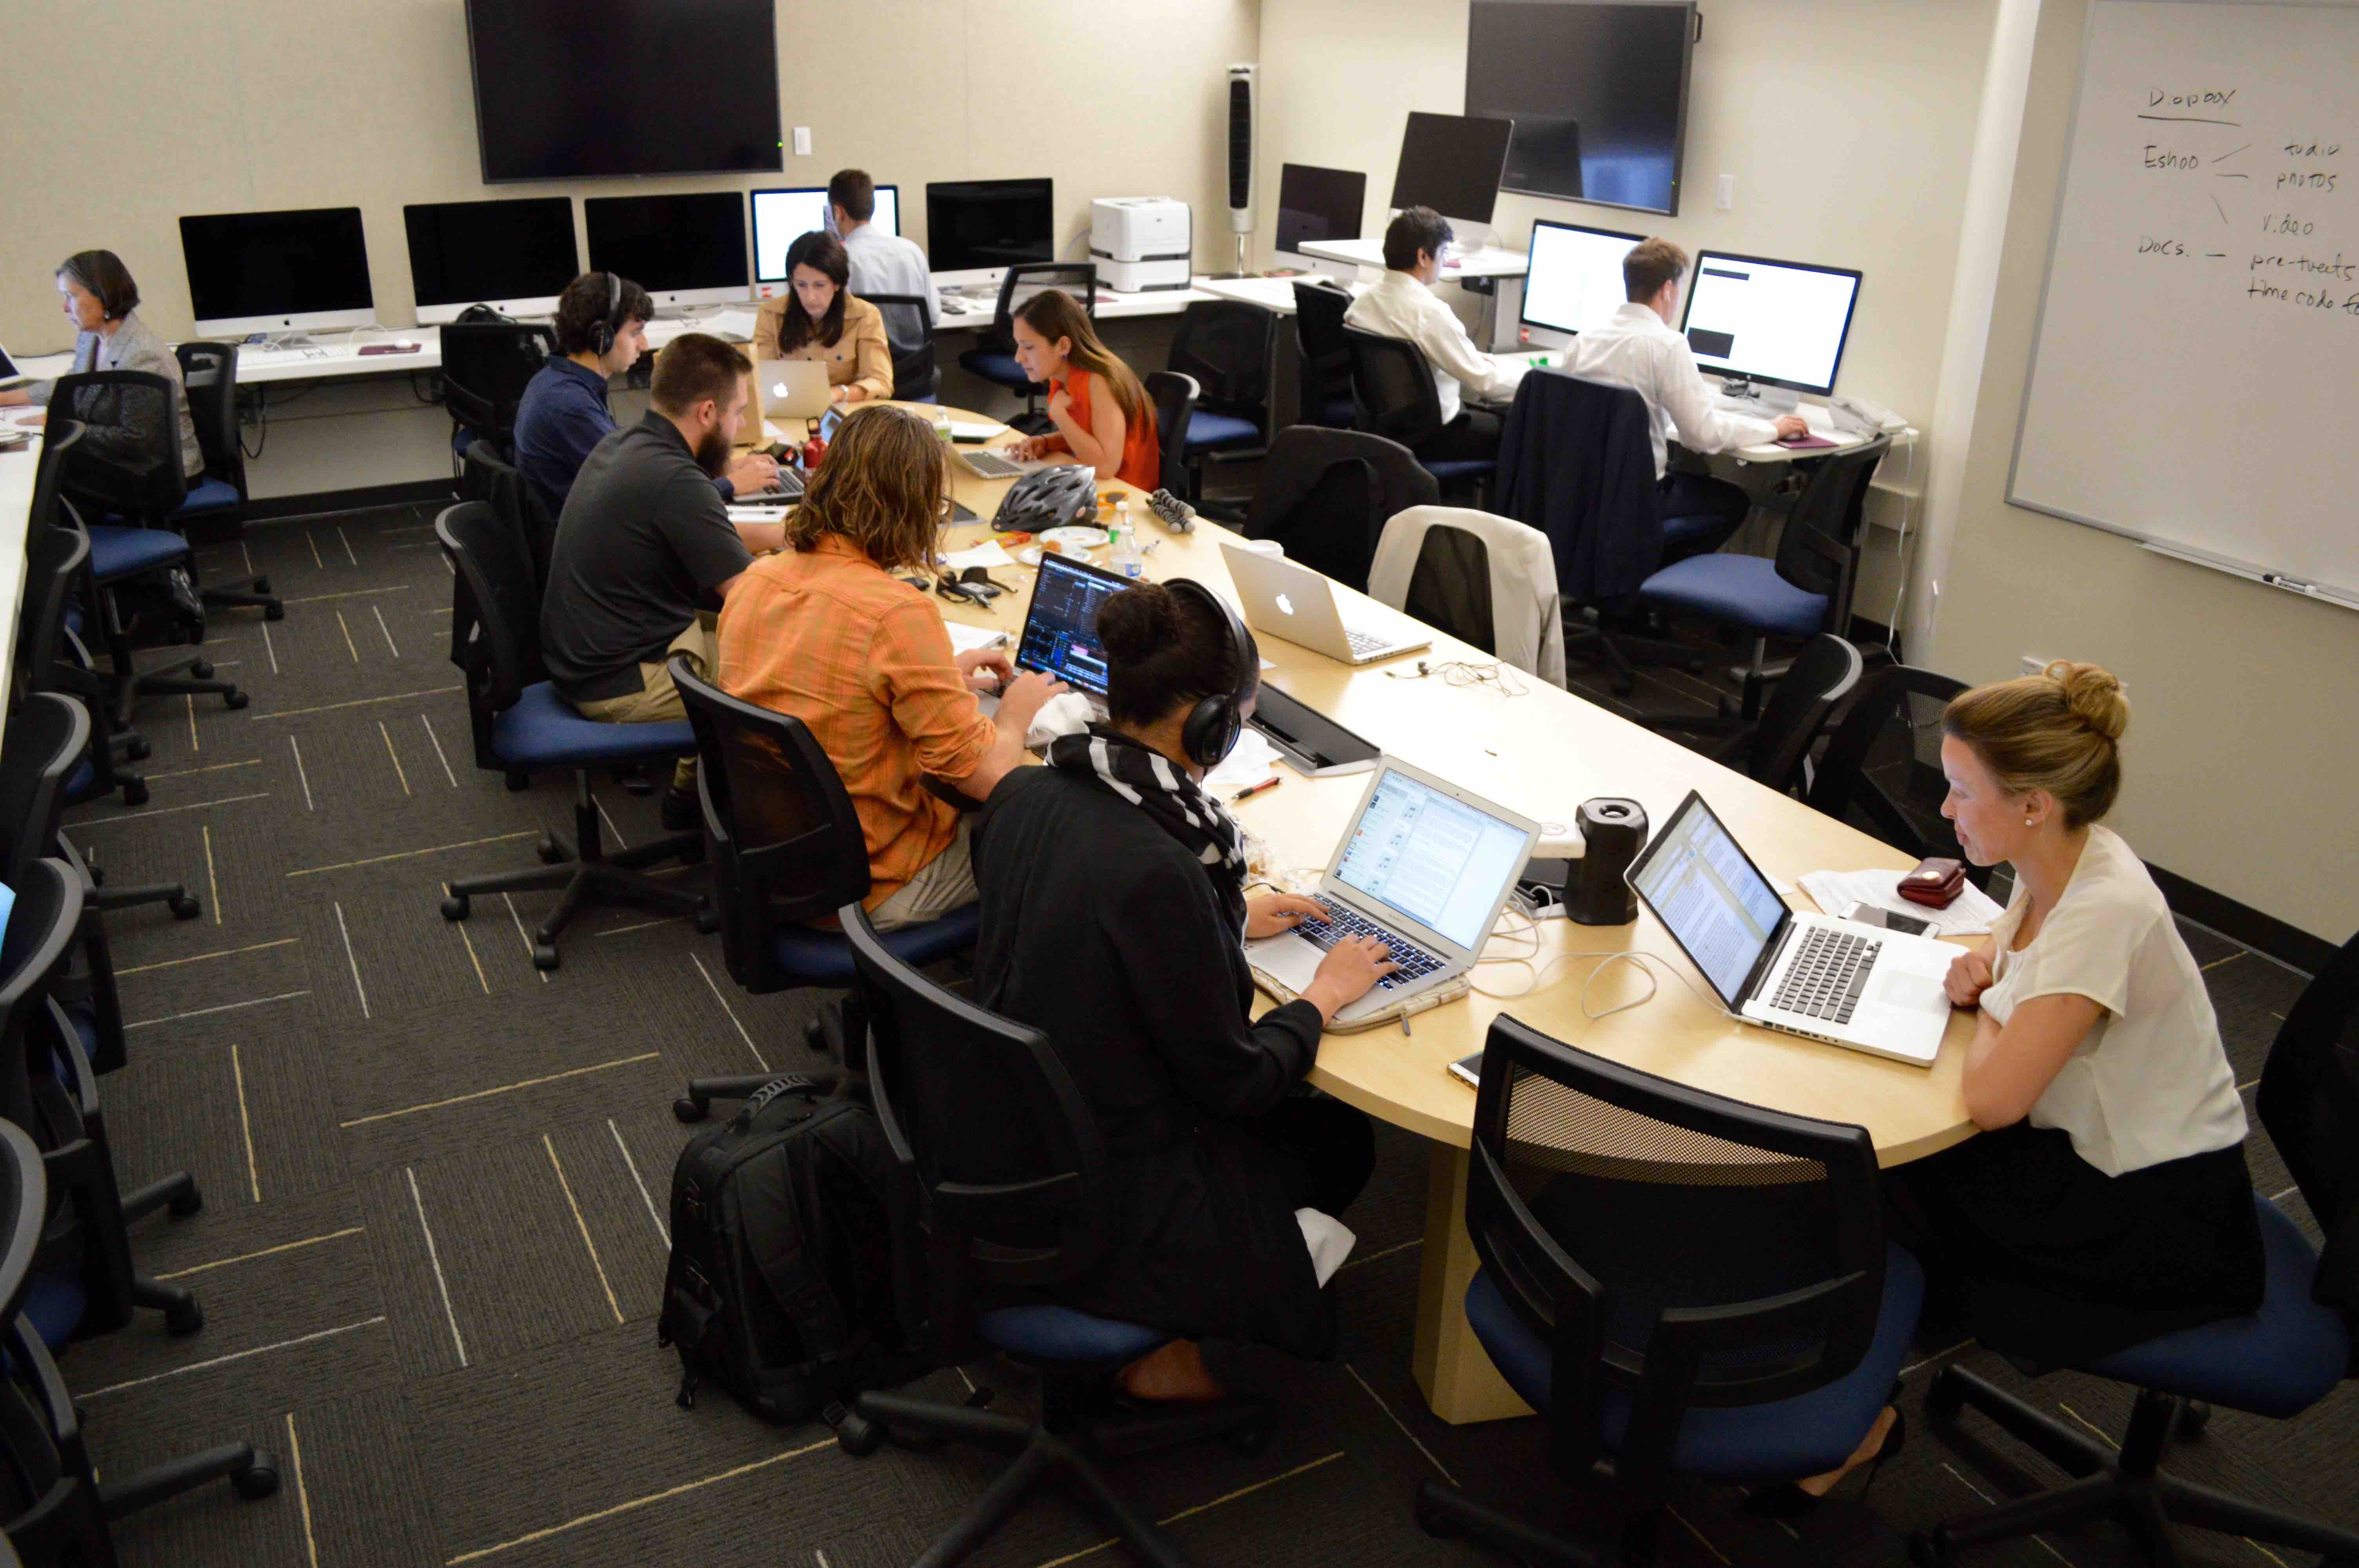
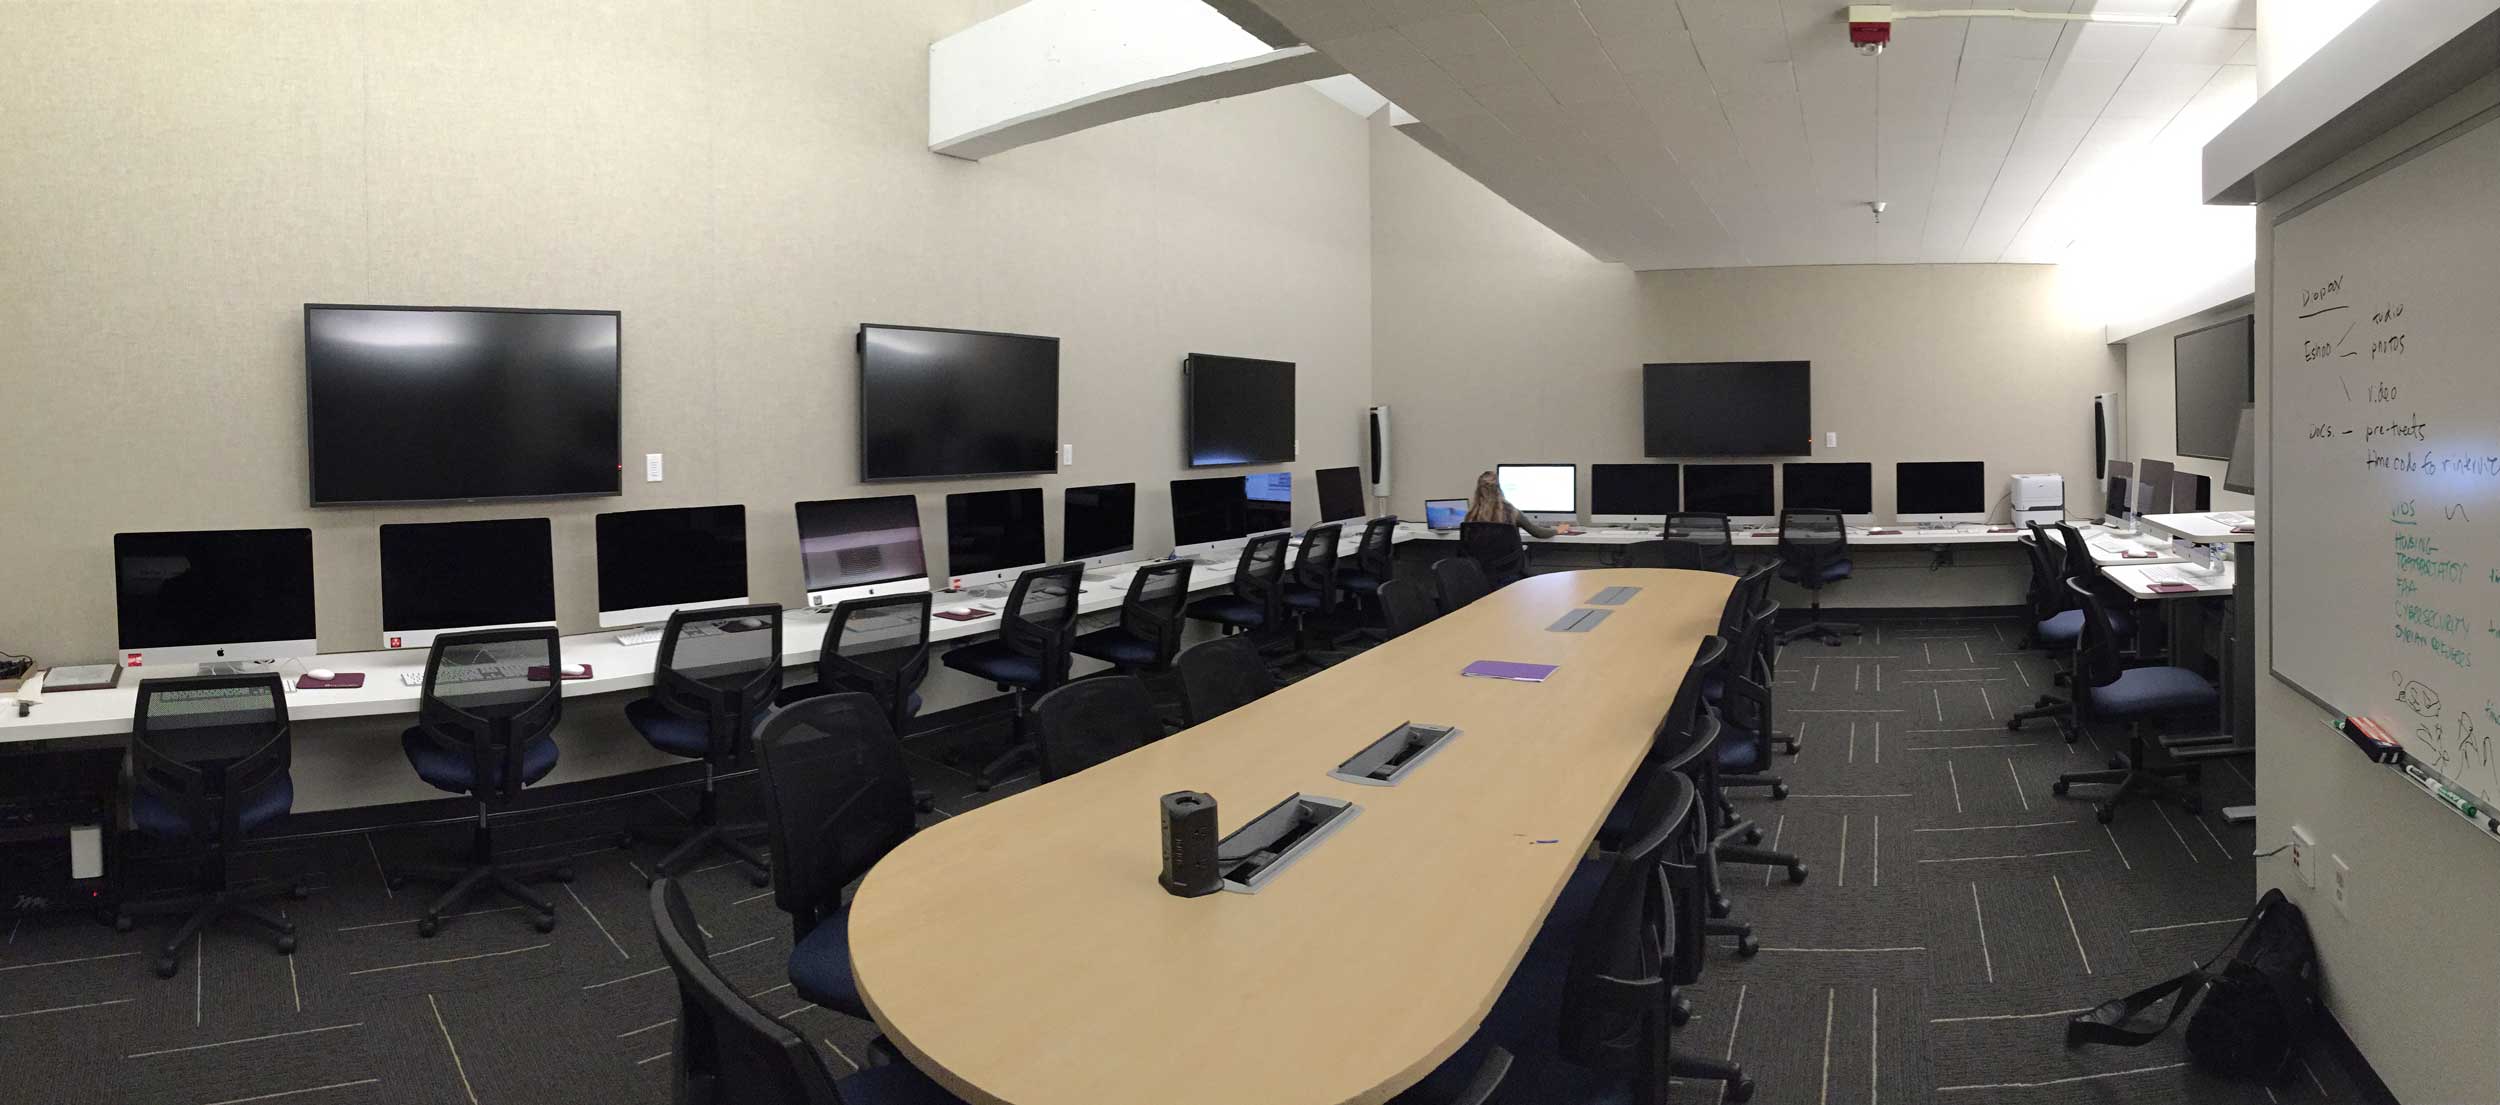


Students enrolled in the Journalism Program have priority access to the Chilton R. Bush Journalism Laboratory, which was recently remodeled with multiple LCD displays, brand-new iMac computers and ergonomic workstations. The space is equipped with a host of new information technology resources: multimedia hardware and software applications (like Final Cut Pro X), data visualization applications (like Tableau, ArcGIS), audio-visual editing and production systems, as well as content management and web-publishing tools. Stanford’s newly updated Lathrop Library offers a wide range of software editing programs, video equipment and a fully staffed tech help desk. The Journalism Program also makes classroom use of Wallenberg Hall, one of the most innovative and technologically-enhanced teaching/learning laboratories in the world that houses a giant “wall of screens.”