
Google Domestic Trends
track Google search traffic across specific sectors of the economy.
Changes in the search volume of a given sector on google.com may provide
unique economic insight. You can access individual trend indexes by clicking
on the left-hand navigation. The indexes are currently calculated only for
US search traffic.
Note: the indexes measure relative query
volume compared to the total number of searches on google.com. Thus, an
index that is decreasing does not imply that the total number of searches is
decreasing; in fact the number of queries could be increasing, just not as
quickly as overall search volume.
Interesting Examples
Google Retail Index and clothing store sales
From the graph below you will see that actual clothing store sales
(source) and the Google Retail
index has been decreasing over time. There are seasonal spikes in clothing
store sales, but over time there has been a pronounced decrease.

Google Auto Buyers Index
User searches related to car buying increased dramatically with the launch of
the US Government's Cash for Clunkers program. We see that the Auto Buyers
Index jumped to 1.4 at the end of July 2009.

![]() Better Predicting real-world statistics
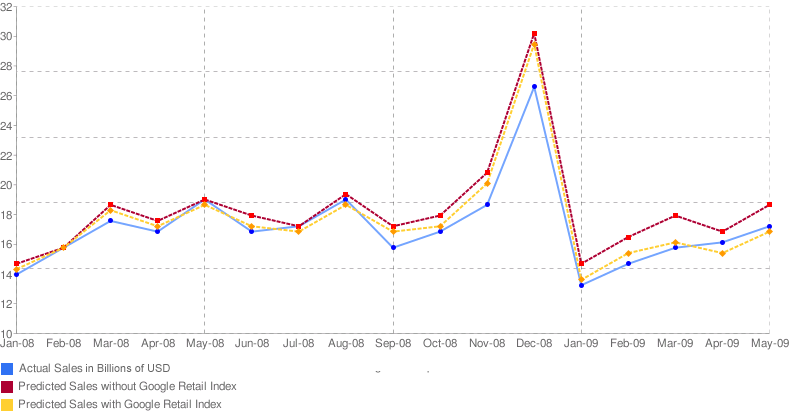
Better Predicting real-world statistics
We wondered if Google search volumes in a month can help better predict
real world statistics well before they are officially tabulated and released.
Predicting retail sales
The US Census Bureau releases the Advance Monthly Retail Sales survey
1–2 weeks after the close of each month. These figures are based on a
mail survey from a number of retail establishments and are thought to be
useful leading indicators of macroeconomic performance.
Learn more
about the survey and the procedures followed in constructing these numbers.
The retail sales data is organized according to the NAICS retail trade categories. The data is reported in both seasonally adjusted and unadjusted form; for the analysis in this section, we use only the unadjusted data for the NAICS category 448 (clothing and clothing accessories stores).
Google Domestic Trends data
The Google RETAIL index tracks query volumes on Google.com related to the
retail trade category. Sample queries are "retail, bags, retail sales". For
more details, visit
Google Insights for Search
. For this analysis we use the index value (30 day moving average)
in the middle of the month. Thus, to predict retail sales of March, 2008 we
use the index value on March 15th, 2008.
We observe that the Mean Absolute Error improves from 6.52% to 3.65% (an improvement of 44%)!
Methodology for Predictions
- Prediction models use a simple linear model:
- Base prediction model for Retail: use last month's value and a
year back (i.e.
 )—t
refers to current month, t-1 is last month,
t-12 is one year earlier.
)—t
refers to current month, t-1 is last month,
t-12 is one year earlier.
- The index was added as an additional independent variable to the respective base prediction model
- Rolling 24-month regression (least squares fit) to get the weights of the terms in the equations using data from 2006-2007. Then using the weights computed predicted values for 2008 and then determine the mean absolute error.
- The index value used for predicting was either the 30 day moving average of the index OR the Year-over-Year change in the 30 day moving average.
The data for these indexes are available for download—so you can use it with your own models. If you find interesting patterns and uses, feel free to share with us!