Climate Change
Climate Change Indicators in the United States

Data source: Various studies 4

Data source: Various studies 5

Data source: Various studies 6

Key Points
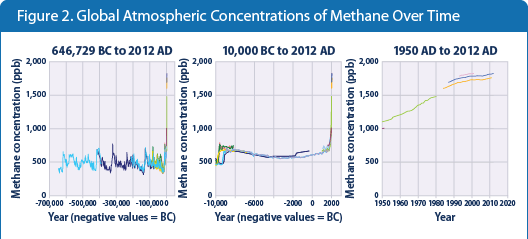
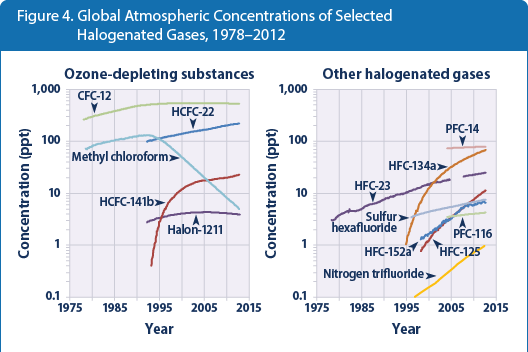
- Global atmospheric concentrations of carbon dioxide, methane, nitrous oxide, and certain manufactured greenhouse gases have all risen over the last few hundred years (see Figures 1, 2, 3, and 4).
- Before the industrial era began in the late 1700s, carbon dioxide concentrations measured approximately 280 ppm. Concentrations have risen steadily since then, reaching an annual average of 394 ppm in 2012—a 41 percent increase. Almost all of this increase is due to human activities. 1
- The concentration of methane in the atmosphere has more than doubled since preindustrial times, reaching about 1,826 ppb in 2012. It is very likely that this increase is predominantly due to agriculture and fossil fuel use. 2
- Historical measurements show that the current global atmospheric concentrations of carbon dioxide and methane are unprecedented compared with the past 650,000 years (see Figures 1 and 2).
- Over the past 100,000 years, concentrations of nitrous oxide in the atmosphere have rarely exceeded 280 ppb. Levels have risen since the 1920s, however, reaching a new high of 325 ppb in 2012 (see Figure 3). This increase is primarily due to agriculture. 3
- Concentrations of many of the halogenated gases shown in Figure 4 (gases that contain chlorine, fluorine, or bromine) were essentially zero a few decades ago but have increased rapidly as they have been incorporated into industrial products and processes. Some of these chemicals are now being phased out of use because they are ozone-depleting substances, meaning they also cause harm to the Earth's ozone layer. As a result, concentrations of some ozone-depleting gases have begun to stabilize or decline (see Figure 4, left panel). Concentrations of other halogenated gases have continued to rise, however, especially where the gases have emerged as substitutes for ozone-depleting chemicals (see Figure 4, right panel). Some of these halogenated gases are considered major greenhouse gases due to their very high global warming potentials and long atmospheric lifetimes (see table).
Background
Since the Industrial Revolution began in the late 1700s, people have added a significant amount of greenhouse gases into the atmosphere by burning fossil fuels, cutting down forests, and conducting other activities (see the U.S. and Global Greenhouse Gas Emissions indicators). When greenhouse gases are emitted into the atmosphere, many remain there for long time periods ranging from a decade to many millennia. Over time, these gases are removed from the atmosphere by emissions sinks, such as oceans, vegetation, or chemical reactions. Emissions sinks are the opposite of emissions sources, and they absorb and store emissions or cause the gases to break down. However, if these gases enter the atmosphere more quickly than they can be removed, their concentrations increase.
Many greenhouse gases remain in the atmosphere for decades or longer. The greenhouse gases being reported here become well mixed throughout the entire global atmosphere because of their long lifetimes and because of transport by winds. Concentrations of other greenhouse gases such as tropospheric ozone, which has an atmospheric lifetime of hours to days, often vary regionally and are not included in this indicator.
Concentrations of greenhouse gases are measured in parts per million (ppm), parts per billion (ppb), or parts per trillion (ppt) by volume. In other words, a concentration of 1 ppb for a given gas means there is one part of that gas in 1 billion parts of a given amount of air. For some greenhouse gases, even changes as small as a few parts per trillion can make a difference in global climate.
About the Indicator
This indicator describes concentrations of greenhouse gases in the atmosphere. It focuses on the major greenhouse gases that result from human activities. These include carbon dioxide, methane, nitrous oxide, and certain manufactured gases known as halogenated gases. This indicator shows concentrations of greenhouse gases over thousands of years. Recent measurements come from monitoring stations around the world, while older measurements come from air bubbles trapped in layers of ice from Antarctica and Greenland. By determining the age of the ice layers and the concentrations of gases trapped inside, scientists can learn what the atmosphere was like thousands of years ago.
Indicator Notes
This indicator includes several of the most important halogenated gases, but some others are not shown. Many other halogenated gases are also greenhouse gases, but Figure 4 is limited to a set of common examples that represent most of the major types of these gases. The indicator also does not address certain other pollutants that can affect climate by either reflecting or absorbing energy. For example, sulfate particles can reflect sunlight away from the Earth, while black carbon aerosols (soot) absorb energy. Data for nitrogen trifluoride (Figure 4) reflect modeled averages based on measurements made in the Northern Hemisphere and some locations in the Southern Hemisphere, to represent global average concentrations over time.
Data Sources
Global atmospheric concentration measurements for carbon dioxide (Figure 1), methane (Figure 2), and nitrous oxide (Figure 3) come from a variety of monitoring programs and studies published in peer-reviewed literature. References for the underlying data are included in the corresponding exhibits. Global atmospheric concentration data for selected halogenated gases (Figure 4) were compiled by the Advanced Global Atmospheric Gases Experiment, 10 the National Oceanic and Atmospheric Administration, 11 and a peer-reviewed study on nitrogen trifluoride. 12 An older figure with many of these gases appeared in the Intergovernmental Panel on Climate Change's Fourth Assessment Report. 13
Technical Documentation
- Download related technical information PDF (9 pp, 322K)


