

Special Report
Street Fight
The Ongoing Battle for Better Bay Area Pavement
The Bay Area’s local streets and roads are a priceless asset, essential to the region’s livability and economic health. Comprising more than 48,000 lane miles of roadway — and not just the paved surfaces but also the curbs and gutters, sidewalks, storm drains, traffic signs, signals and lights that are necessary for functioning roadways — the local street and road network provides access to jobs, homes, schools, shopping and recreation for motorists, bicyclists and pedestrians alike. Yet the condition of this asset is fair at best and its future is precarious.
Pavement Condition Index
| Very Good-Excellent (PCI = 80-100) |
Newly constructed for resurfaced pavement with few signs of distress. |
| Good (PCI = 70-79) |
Pavement requiring mostly preventive maintenance and showing only low levels of distress. |
| Fair (PCI = 60-69) |
Pavement at the low end of this range is significantly distressed and may require a combination of rehabilitation and preventive maintenance. |
| At Risk (PCI = 50-59) |
Deteriorated pavement requiring immediate attention, including rehabilitative work. |
| Poor (PCI = 25-49) |
Pavement showing extensive distress and requiring major rehabilitation or reconstruction. |
| Failed (PCI = 0-24) |
Extremely rough pavement that needs complete reconstruction. |
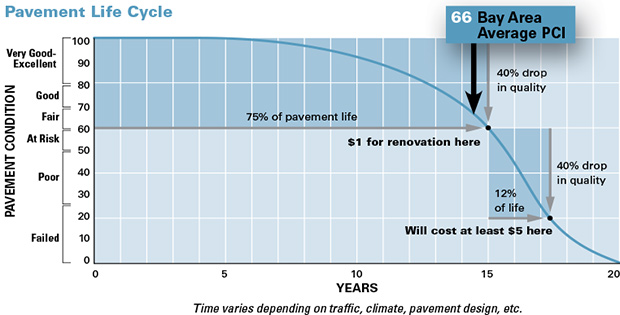
The typical stretch of Bay Area asphalt shows serious wear and likely will require rehabilitation soon. At 66 out of a possible 100 points, the region’s average pavement condition index (PCI) score is much closer to the 60-point threshold at which deterioration accelerates rapidly and the need for major rehabilitation becomes much more likely than to the 75-point score that MTC has established as a target for roadway quality. Indeed, despite efforts by the Commission and the region’s local governments, the Bay Area's battle against potholes has at best been fought to a draw: overall conditions on city streets and county roads essentially are the same now as they were in 2001.
To achieve the goal of a local street and road network that's solidly in the “good” category, Bay Area cities and counties must accommodate myriad — and sometimes competing — priorities, and overcome enduring challenges that are both physical and fiscal.

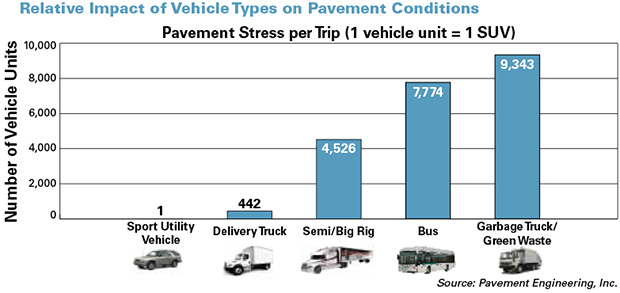
The physical challenges are quite simple: streets and roads take a beating under the weight of traffic. Not surprisingly, heavy vehicles such as trucks and buses put more stress on pavement than does a passenger car, with this additional stress exacerbated by frequent stopping and starting. What may be surprising, however, is just how much bigger the impact of heavier vehicles really is. A delivery truck exerts more than 400 times the stress on pavement than does a typical sport utility vehicle, while a garbage truck exerts more than 9,000 times as much stress as an SUV. This illustrates the competing priorities that often must be considered in the battle for better pavement. No matter how important the goal of a smooth ride may be, the sacrifice of either curbside waste collection or convenient and reliable transit service at the altar of perfect asphalt is not a viable policy option.
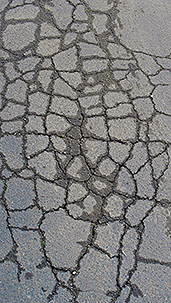
Cracking usually is the first sign of pavement distress.
Cracking usually is the first sign of distress on any surface pavement. While cracks may not immediately alter the pavement’s ride quality, they expose the sub-base of the roadway to water leaking through the surface layer. In time, water erodes pavement strength and cracks begin to lengthen and multiply, forming networks of interconnected cracks referred to as “alligator cracking.” At this point, the pavement is no longer able to sustain the weight of traffic and the cracked pavement disintegrates, forming depressions more familiarly known as potholes.
Since potholes result from damage to the roadway’s sub-base, once they appear — regardless of whether or not they are patched — the roadway will continue to deteriorate until it reaches a failed state. Predictably, cracks appear more quickly on streets with large traffic volumes and/or heavy use by trucks and buses; and these roadways need maintenance more frequently than residential streets with comparatively light vehicle traffic. About 28 percent of the Bay Area’s local street and road mileage consists of arterial and collector roadways, which are heavily used by both trucks and buses.
The pounding that pavement receives from trucks and buses can be especially problematic in more rural parts of the Bay Area, where many roadways have not been designed to accommodate heavy vehicles but which are nonetheless used by growing numbers of trucks carrying goods between farms and cities. A 2014 report by The Road Information Project, or TRIP, a nonprofit organization that researches, evaluates and distributes technical data on transportation issues, estimates that 49 percent of Bay Area roadways — including state highways as well as local streets and roads — are in poor condition.
The Fiscal Challenge
Simple though the physical challenges may appear to be, persistent funding shortages have made progress in the effort to boost the regionwide average PCI score to 75 or higher frustratingly hard to come by. Indeed, pavement quality scores have been stuck in "fair" territory for the better part of a generation
Like the rest of the region's transportation network, our local streets and roads are experiencing both growing pains and aging pains. "Our cities and counties face a double whammy of challenges," explains Hans Larsen, Transportation Director for the City of San Jose. "We're in a region where things are growing fast, and there's a need to invest in transportation to support growth. At the same time, we have transportation systems, many of them built 50 or more years ago, that are aging and falling apart, and need investment. There are not enough dollars today to deal with either growth or maintaining what we have."
MTC estimates that city and county governments will need to spend close to $25 billion, or $875 million a year through 2040, to meet the 75-point target for the average PCI score on the region's local street and road network. This level of investment is over three times higher than the current $285 million spent annually by all sources on roadway maintenance. Fixing this fiscal pothole has long been a challenge for MTC, and for the Bay Area's nine counties and 101 cities. And as pavements continue to age and maintenance continues to be deferred, the cost of meeting this challenge is expected to rise sharply.
Unincorporated Contra Costa County, which historically has boasted some of the Bay Area's best pavement conditions, but has seen its road network's three-year moving average PCI score drop from 75 to 69 since 2011, has a maintenance backlog of about $39 million, according to Julia R. Bueren, Director of the county's Public Works Department. "In 20 years, at our current level of investment, that will be about a $6 billion backlog."
"Because we haven't had the money to take care of it," says Larsen, the City of San Jose, whose street network is the largest of any Bay Area government (more than 1,900 centerline miles and over 4,200 lane miles; or about 2,400 miles using an average 30-foot curb-to-curb street width) "has accumulated a backlog that's over $400 million and 25 percent of our streets are in poor condition. The startling reality is if we don't act now to improve it, it's only going to cost more in the future. We have projected by the year 2020 — six short years from now — our backlog will grow from $400 million to $800 million and the share of our streets in poor condition will balloon from 25 percent to 50 percent."
Unpredictable Revenue Streams
Funding for roadway maintenance typically comes from a range of sources, including the state gasoline tax, county sales taxes, and local sources such as city or county general funds, bonds and traffic-impact fees. Yet as the need for maintenance grows, the available funding from these sources generally has been shrinking in relation to the growing maintenance needs. The 18 cents-per-gallons federal excise tax on gasoline has not been raised since 1993, and the state’s base 18 cents-per-gallon gas tax has remained unchanged since 1994. Inflation erodes the impact of these revenue streams by 2 percent to 3 percent each year, with gas taxes losing more than half their purchasing power over the past two decades. And county transportation sales taxes — from which receipts tend to fluctuate dramatically based on the strength or weakness of the regional economy — typically dedicate less than 25 percent of revenues to local street and road maintenance. Against this backdrop, several local governments in recent years have taken steps to secure new revenue streams for the maintenance and repair of their street systems. The pioneering approach taken by the Contra Costa County city of El Cerrito is explored in greater detail below.
Many Different Roads
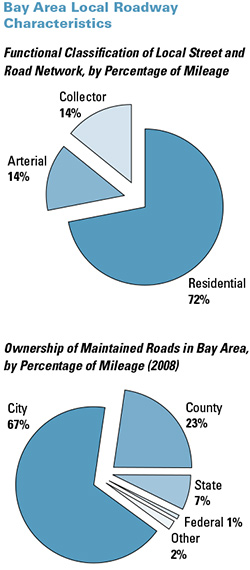
Just as there are a variety of funding sources for pavement maintenance, and different ranges of pavement quality, so too are there various classifications for local streets and roads. A roadway’s “functional classification” is determined primarily by the number of vehicles that use it. About 70 percent of roadways are residential (see chart at right). These are the streets and roads that run through neighborhoods and carry few buses or trucks, other than waste management vehicles. Collector roadways serve to “collect” traffic from the residential streets and deposit them onto arterials, which carry the most car, truck and bus traffic, and which typically provide an outlet onto state highways or freeways. Federal funding can be used only on roadways that have a functional classification of collector or arterial, or roughly 28 percent of the Bay Area street system.
Local streets and roads, which are owned and maintained by cities or counties, account for 90 percent of the Bay Area’s total lane mileage. State highways (including interstate highways) are maintained by Caltrans and comprise about 7 percent of total mileage. Roadways that fall under the responsibility of the federal government primarily include those in national parks, reserves, tribal lands and military installations. About 2 percent of roadways are either privately owned, or are owned and maintained by special districts such as the East Bay Regional Park District, the California Department of Parks and Recreation or the Golden Gate Bridge, Highway and Transportation District.
Many factors affect a city’s or county’s pavement condition index, or PCI score. These include pavement age, climate and precipitation, traffic loads and available maintenance funding. A municipality with new housing developments and new streets may have a high overall PCI, while an older, urbanized jurisdiction may have a much lower PCI, even though both are practicing pavement preservation. Cities and counties that practice preventive maintenance will have lower long-term pavement costs and will safeguard their investment in local streets and roads.
Importance of Early Intervention
MTC has long advocated pavement preservation to help cities and counties get the biggest bang for their pavement buck. Just as regular oil changes are far less expensive than a complete engine rebuild, it is five to 10 times cheaper to properly maintain streets than to allow them to fail and then pay for the necessary rehabilitation (see chart above). Deteriorating pavement carries private costs as well. "Approximately $800 a year is spent by Bay Area motorists maintaining their vehicles," says Rocky Moretti of TRIP. "These are additional costs that they're paying because of the rough roads in the region.
The most cost-effective way to maintain a roadway is to address cracks in the pavement as soon as they surface. Bay Area cities and counties have embraced the importance of early intervention through the adoption of proactive maintenance strategies, better education in pavement preservation concepts, and regional policies that give local governments incentives to practice pavement preservation on their street and road networks. Plan Bay Area, the long-range transportation and land-use strategy adopted by MTC and the Association of Bay Area Governments in 2013, reaffirms this approach by conditioning regional funds for local street and road maintenance not only on need and level of system usage but also on preventive-maintenance performance.
By contrast, cities and counties that spend almost all of their paving budgets to fix only a handful of failed roadways, instead of proactively maintaining a much larger percentage of their network that is still in good condition, are practicing what is known as a “Worst First” strategy. With this approach, the good roads for which maintenance is deferred soon fall into disrepair and require more extensive and costly treatments. While the Bay Area's target of overall "good" quality pavement remains elusive, cities’ and counties’ support for preventive maintenance — and their shift away from the ineffective “Worst First” strategy — has helped local governments effectively stabilize PCI scores in the "fair" range despite rising costs for paving materials and a steady decline in the purchasing power of most municipalities’ pavement maintenance budgets.
“If you have money to seal your streets on a regular basis, you don’t develop the cracks and the underlying damage,” explains San Jose’s Larsen.
Pavement Management Boosts Preservation Returns
Building on pavement preservation principles established by the Federal Highway Administration, MTC developed a pavement management software package called StreetSaver® to assist local agencies in maintaining their roadways. StreetSaver integrates the three main pavement preservation components: preventive maintenance, minor rehabilitation (non-structural) and routine maintenance, as well as rehabilitation and reconstruction. Today, all 109 Bay Area jurisdictions — and more than 300 additional public agencies nationwide — use StreetSaver. The software allows cities and counties to inventory their street networks, determine their maintenance needs and devise maintenance programs based on available revenues. The software develops a list of recommended treatments (classified as preventive maintenance, minor rehab, major rehab or reconstruction), and prioritizes treatments based on a weighted effectiveness ratio. Within the constraints of the local government's budget, StreetSaver selects the most cost-effective treatments for implementation, and defers the remainder.
As with any other software package, StreetSaver's effectiveness depends on the input of reliable data. So for StreetSaver to work, public works staff must promptly enter updated information about maintenance treatments once the treatments have been applied.
Benefits of a Pavement Management System
- Provide a systematic way of gauging pavement conditions, and present a series of steps for using this information to identify and schedule the most appropriate treatments.
- Help cities and counties make more efficient use of public funds by allowing them to immediately put any available new moneys to their most cost-effective use.
- Allow local governments to predict what conditions would be at different levels of funding, and to quantify the consequences of underfunded road maintenance.
- Allow local governments to establish performance-based funding allocation policies.
- Reduce governments’ overall maintenance spending once the management system reaches its goal of getting all pavement segments to the condition where preservation is the primary strategy being applied.
- Build support for increased funding by systematically tracking pavement inventories, conditions and maintenance activities across multiple jurisdictions.
Sonoma County: Pavement Problems Converge on Rural Roads
As we've seen, many factors affect a city’s or county’s PCI score. These include the size of the street or road network, the age of the pavement, climate and precipitation, traffic loads and available maintenance funding. One place where older pavement, higher rainfall and heavier traffic loads all come together is in Sonoma County, where PCI scores on a vast network of roads (including more than 1,300 centerline miles and over 2,700 lane miles) in the unincorporated portions of the county consistently have ranked among the very lowest of any Bay Area jurisdiction. More than half of the county's road network is in "poor" or "failed" condition, and just 16 percent of county-owned pavement is rated "excellent" or "very good." The numbers add up to a road system firmly in the "poor" category, with average PCI scores of 46 for the network as a whole and just 34 for less-traveled county roads carrying a residential classification.
Save Our Sonoma Roads, a nonprofit citizens group established in 2011 to advance public education about pavement issues and to advocate for increased public funding of roadway maintenance, repair and rehabilitation throughout Sonoma County, asserts that decades of underinvestment in preventive maintenance and pavement preservation are responsible for the deterioration of the county's largely rural road network.
"I think it's a question of deferred maintenance," observes Craig Harrison, a rural Sonoma County resident who co-founded Save Our Sonoma Roads. "You can get away with deferring maintenance for a year or two, and everyone does that in their own lives. You have a short-term fiscal problem and you don't do things you'd like to do. But a year or two later you sort of circle back and fix it. But if you go on for a decade or 15 years, that little leak that would have cost you a couple hundred dollars to fix is suddenly starting the whole roof to collapse, and you're looking at a $30,000 problem. And that's what I'm afraid has happened to our county roads."
"In this county," continued Harrison, "the Board of Supervisors years ago established what they call the Primary Road System, which is the 200 miles that are most used and most traveled — and those are fairly well maintained. The other 1,183 miles or so are subject to irregular funding and are possibly destined to go to dirt or gravel in the next decade or two if something isn't to correct the situation. … It's an interesting problem, and very complicated."
Sales Taxes Strategy Delivers Impressive Improvement

El Cerrito streets have had a major makeover, funded in part by revenues from a voter-approved sales tax.
The Contra Costa County city of El Cerrito chose to tackle the complicated problem of pavement maintenance head-on. In 2006, El Cerrito’s 138 lane-miles of local streets were in poor condition (single-year PCI score of 48) and the city had a backlog of more than $21 million in maintenance work. Four years later, the city had boosted its single-year PCI score to 85 and had trimmed its maintenance backlog to just $500,000. By 2013, El Cerrito's one-year PCI score had dipped slightly to 83 but its three-year moving PCI average skyrocketed to 84 from just 62 three years earlier. How did El Cerrito improve pavement conditions so much and so quickly?
"It was not even that the streets were bad," recalls El Cerrito Mayor Janet Abelson. "The pavement was gone. It was on its way to being a dirt road, that's how bad it was — because we hadn't had, for many years, the money to repave our streets. We surveyed our residents and said to them, 'Is there anything, if we did a measure, that you would want?' And overwhelmingly, the answer was: streets. We got the message. "
After launching a public outreach campaign that included citizens, city council members and public works staff, El Cerrito in 2008 won overwhelming approval of a half-cent sales tax measure for a Street Improvement Program. Within three years, the city had used $2.1 million in sales tax revenues — augmented by $10.5 million in bond proceeds and $1.8 million in grant funds — to slash its pavement maintenance backlog from $21 million to $500,000 and had also resurfaced two-thirds of its streets, built over 400 new curb ramps and replaced 50 storm drain crossings. The half-cent sales tax created a direct, permanent and local source of funding that now generates an estimated $1.5 million of revenue each year for future pavement maintenance.
El Cerrito’s Pavement Program and Conditions, 2006-13
|
2006 |
2010 |
2013 |
|---|---|---|---|
Single-year PCI score |
48 (Poor) |
85 (Very Good) |
83 (Very Good) |
PCI: 3-year moving average |
53 (At Risk) |
62 (Fair) |
83 (Very Good) |
Maintenance backlog |
$21.2 million |
$500,000 |
$500,000 |
Annual budget needed to maintain PCI |
$1.3 million |
$500,000 |
$900,000 |
Annual average funding level |
$250,000 |
$500,000 |
$900,000 |
Inspired in part by the success of the El Cerrito Street Improvement Program, two other Contra Costa County cities placed similar sales tax measures on the ballot four years later, with 69 percent of voters in Orinda endorsing Measure L, a quarter-cent sales tax to finance the repair, rehabilitation and maintenance of local streets; and 70 percent of voters in neighboring Moraga approving Measure K, which provides a full cent on each dollar of taxable sales for pavement repair and rehabilitation, and for storm drain repair. Measure K's impact was felt almost immediately, as Moraga used the new sales-tax revenue stream to support a successful bond issue that generated nearly $8 million for the town's pavement management program over the next three years; and the one-year PCI score on Moraga's 110 lane-miles of local streets climbed eight points to 58 last year from just 50 in 2012.
Edric Kwan, Moraga's Public Works Director, credited StreetSaver with helping build public support for Measure K. "StreetSaver was useful to explain the concept of preventive maintenance to the public. The initial phase of our strategy was to treat those roads that are already in relatively good condition to prevent them from deteriorating. Next, we will devote more of the funds toward those streets that require more heavy-duty treatments. It's important to demonstrate to the public that we are making smart decisions with their money."
MTC Chair and Orinda City Councilmember Amy Rein Worth also pointed to the role played by StreetSaver in her city's approval of Measure L. "StreetSaver helped us develop paving priorities that gained voter support. The software provided solid engineering information that aided our Public Works Department and our Citizens Infrastructure Oversight Commission in recommending a plan that made sense — both in terms of the road and street repair, and in the allocation of tax dollars."
What Can be Done?
The allocation of tax dollars lies at the very heart of cities’ and counties’ continuing struggle to elevate the quality of Bay Area pavement. Predictable, long-term funding is imperative if local governments are to travel toward a pothole-free future. But the gap between available funds and identified needs is enormous. And every local government must balance a host of competing priorities that includes streets and roads, public safety, parks and recreation, employee and retiree benefits, and many more.
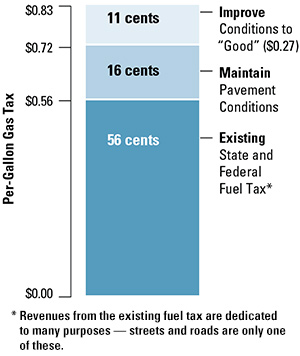 To simply hold the line and maintain the current "fair" condition (PCI of 66) of the Bay Area’s local streets and roads, new revenues roughly equal to a 16-cent increase in the gas tax — and dedicated to local street and road maintenance — would be needed. To reach MTC's goal of an average “good” pavement condition (PCI of 75) across the region, the new funding required would be equal to a 27-cent increase in the gas tax. To also improve the region’s curbs, sidewalks, storm drains, streetlights and other non-pavement assets to a “good” condition, another 21 cents per gallon would be necessary.
Steep as the climb toward adequate funding for local streets and roads may be, the challenge is made more daunting by the similar shortfalls facing other elements of the regional transportation network. Plan Bay Area, the long-term transportation investment and land-use plan adopted last year by MTC and the Association of Bay Area Governments, identifies a $17 billion shortfall in funding to keep buses, railcars, ferries, stations, tracks and other transit capital assets in a state of good repair from 2013 through 2040; plus another $8 billion in unfunded needs for maintenance of state highways in the region during this time.
 Plan Bay Area directs $10 billion through 2040 to help cities and counties maintain the region’s existing pavement condition. These are federal funds that may be invested at MTC’s discretion, and are accessed by local governments through the Commission’s new One Bay Area Grant (OBAG) program. A key requirement is that to qualify for OBAG funding, cities and counties must embrace the concept of Complete Streets, a design approach that has emerged over the past generation to make roadways — particularly those in urban areas — more pedestrian- and bicycle-friendly. While there is no standard template, common elements typically include bike lanes, sidewalk bike racks, transit stops, pedestrian signals, street trees and curb ramps. By incorporating these elements into Complete Streets, transportation agencies help ensure that people of all ages and abilities can use the street safely.
Complete Streets

- Pavement Costs Attributed to Cars
- Pavement Costs Attributed to Buses/Trucks
- Pavement Costs Attributed to Bicycles
- Lights/Signs/Markings
- Curb and Gutter
- Storm Drain
- Sidewalk and ADA Ramp
- Traffic Signal
- Street Furniture and Plantings
Costs for Complete Streets projects may run 15 percent to 25 percent higher than traditional treatments.
Because each street is unique, the cost of upgrading to a Complete Street can vary widely from project to project. But, on average, costs for Complete Street projects tend to run 15 percent to 25 percent higher than those for projects without these enhancements.
While voters in El Cerrito, Moraga and Orinda have decided that local streets are a civic priority worthy of predictable, long-term investment, these cities remain the exception rather than the rule. Together, the Bay Area's nine counties and 101 cities currently invest about $285 million annually in maintaining local streets and roads. If investment continues at this level, average regional pavement quality will deteriorate to poor condition (PCI of 45) by 2040, and the typical Bay Area street of the not-too-distant future would closely resemble today's county road in rural Sonoma County. To bring the Bay Area's average stretch of pavement up to good condition (PCI of 75), the region will need to triple maintenance expenditures to $875 million. The chart below details the average pavement conditions that are projected at each investment level.
It remains to be seen whether more local governments will follow the lead set by El Cerrito. But all governments, when considering the renewal and/or reauthorization of funding measures and long-range plans, must heed the cost of maintaining streets and roads at a good state of repair. Otherwise, both the fiscal and physical challenges facing local streets and roads will endure for another generation, and the pothole battle surely will be lost.

Pavement Condition Index (PCI) for Bay Area Jurisdictions, 2011–2013
|
|
|
3-Year Moving Average |
||
|---|---|---|---|---|---|
Jurisdiction |
County |
Total |
2011 |
2012 |
2013 |
Very Good (PCI=80–89) |
|||||
Brentwood |
Contra Costa |
406 |
86 |
87 |
86 |
Dublin |
Alameda |
254 |
84 |
86 |
85 |
El Cerrito |
Contra Costa |
138 |
73 |
84 |
84 |
Atherton |
San Mateo |
106 |
79 |
81 |
81 |
Belvedere |
Marin |
23 |
85 |
83 |
81 |
Foster City |
San Mateo |
120 |
81 |
81 |
81 |
|
|
|
3-Year Moving Average |
||
Jurisdiction |
County |
Total |
2011 |
2012 |
2013 |
Good (PCI=70–79) |
|||||
Los Altos |
Santa Clara |
226 |
81 |
80 |
79 |
Union City |
Alameda |
331 |
79 |
79 |
79 |
Portola Valley |
San Mateo |
71 |
77 |
77 |
78 |
San Pablo |
Contra Costa |
102 |
79 |
79 |
78 |
San Ramon |
Contra Costa |
461 |
76 |
76 |
78 |
Redwood City |
San Mateo |
353 |
77 |
77 |
78 |
Daly City |
San Mateo |
254 |
77 |
78 |
77 |
Dixon |
Solano |
125 |
78 |
77 |
77 |
Livermore |
Alameda |
680 |
78 |
78 |
77 |
Los Altos Hills |
Santa Clara |
115 |
77 |
77 |
77 |
Palo Alto |
Santa Clara |
470 |
74 |
76 |
77 |
Pleasanton |
Alameda |
500 |
77 |
77 |
77 |
Sunnyvale |
Santa Clara |
638 |
76 |
76 |
77 |
Brisbane |
San Mateo |
53 |
77 |
77 |
76 |
Clayton |
Contra Costa |
94 |
74 |
75 |
76 |
Emeryville |
Alameda |
47 |
78 |
78 |
76 |
Menlo Park |
San Mateo |
197 |
68 |
72 |
76 |
Newark |
Alameda |
250 |
71 |
73 |
76 |
Burlingame |
San Mateo |
160 |
76 |
74 |
75 |
Lafayette |
Contra Costa |
199 |
73 |
74 |
75 |
Santa Clara |
Santa Clara |
590 |
78 |
76 |
75 |
Solano County |
Solano |
929 |
68 |
71 |
75 |
Campbell |
Santa Clara |
227 |
75 |
74 |
74 |
Morgan Hill |
Santa Clara |
258 |
77 |
76 |
74 |
Oakley |
Contra Costa |
283 |
75 |
74 |
74 |
Santa Clara County |
Santa Clara |
1428 |
74 |
75 |
74 |
Colma |
San Mateo |
24 |
68 |
70 |
73 |
Gilroy |
Santa Clara |
257 |
74 |
74 |
73 |
Hillsborough |
San Mateo |
167 |
72 |
73 |
73 |
Mountain View |
Santa Clara |
332 |
75 |
75 |
73 |
San Mateo |
San Mateo |
412 |
72 |
72 |
73 |
Tiburon |
Marin |
68 |
70 |
73 |
73 |
Danville |
Contra Costa |
321 |
72 |
72 |
72 |
Hercules |
Contra Costa |
122 |
74 |
74 |
72 |
Ross |
Marin |
22 |
69 |
70 |
72 |
Saratoga |
Santa Clara |
283 |
72 |
73 |
72 |
Alameda County |
Alameda |
990 |
73 |
72 |
71 |
Fairfield |
Solano |
713 |
73 |
73 |
71 |
Novato |
Marin |
318 |
73 |
72 |
71 |
South San Francisco |
San Mateo |
296 |
72 |
71 |
71 |
Walnut Creek |
Contra Costa |
435 |
71 |
71 |
71 |
Corte Madera |
Marin |
71 |
71 |
71 |
70 |
Los Gatos |
Santa Clara |
221 |
68 |
69 |
70 |
San Rafael |
Marin |
331 |
74 |
72 |
70 |
Sonoma |
Sonoma |
68 |
74 |
71 |
70 |
Windsor |
Sonoma |
173 |
72 |
70 |
70 |
|
|
|
3-Year Moving Average |
||
Jurisdiction |
County |
Total |
2011 |
2012 |
2013 |
Fair (PCI=60–69) |
|||||
Antioch |
Contra Costa |
670 |
69 |
69 |
69 |
Contra Costa County |
Contra Costa |
1320 |
75 |
72 |
69 |
Milpitas |
Santa Clara |
298 |
68 |
69 |
69 |
Piedmont |
Alameda |
78 |
73 |
71 |
69 |
San Mateo County |
San Mateo |
623 |
69 |
69 |
69 |
Hayward |
Alameda |
657 |
69 |
69 |
68 |
Pinole |
Contra Costa |
119 |
69 |
70 |
68 |
Vacaville |
Solano |
582 |
73 |
70 |
68 |
Yountville |
Napa |
17 |
71 |
69 |
68 |
Alameda |
Alameda |
275 |
67 |
68 |
67 |
Monte Sereno |
Santa Clara |
27 |
69 |
70 |
67 |
Rohnert Park |
Sonoma |
207 |
68 |
68 |
67 |
Cupertino |
Santa Clara |
300 |
70 |
68 |
66 |
Woodside |
San Mateo |
96 |
58 |
62 |
66 |
Fairfax |
Marin |
55 |
68 |
66 |
65 |
Pleasant Hill |
Contra Costa |
225 |
66 |
66 |
65 |
Richmond |
Contra Costa |
571 |
58 |
61 |
65 |
San Francisco |
San Francisco |
2138 |
64 |
64 |
65 |
Cloverdale |
Sonoma |
65 |
68 |
66 |
64 |
Fremont |
Alameda |
1069 |
63 |
63 |
64 |
Sausalito |
Marin |
52 |
63 |
63 |
64 |
American Canyon |
Napa |
107 |
71 |
67 |
63 |
Concord |
Contra Costa |
715 |
72 |
67 |
63 |
Pittsburg |
Contra Costa |
334 |
64 |
64 |
63 |
Santa Rosa |
Sonoma |
1097 |
65 |
64 |
63 |
Sebastopol |
Sonoma |
47 |
64 |
64 |
63 |
Napa |
Napa |
463 |
58 |
60 |
62 |
San Jose |
Santa Clara |
4271 |
64 |
63 |
62 |
Suisun City |
Solano |
152 |
68 |
67 |
62 |
Healdsburg |
Sonoma |
93 |
63 |
61 |
61 |
San Bruno |
San Mateo |
179 |
63 |
61 |
61 |
Half Moon Bay |
San Mateo |
54 |
59 |
56 |
60 |
Martinez |
Contra Costa |
230 |
60 |
60 |
60 |
Mill Valley |
Marin |
117 |
62 |
62 |
60 |
Oakland |
Alameda |
1923 |
57 |
58 |
60 |
San Carlos |
San Mateo |
175 |
65 |
63 |
60 |
|
|
|
3-Year Moving Average |
||
Jurisdiction |
County |
Total |
2011 |
2012 |
2013 |
At-Risk (PCI=50–59) |
|||||
Benicia |
Solano |
190 |
61 |
60 |
59 |
Millbrae |
San Mateo |
125 |
62 |
61 |
59 |
Berkeley |
Alameda |
453 |
59 |
59 |
58 |
Napa County |
Napa |
834 |
60 |
59 |
58 |
Pacifica |
San Mateo |
188 |
60 |
59 |
58 |
Rio Vista |
Solano |
46 |
47 |
51 |
58 |
San Anselmo |
Marin |
81 |
56 |
57 |
58 |
Calistoga |
Napa |
31 |
61 |
59 |
57 |
Cotati |
Sonoma |
46 |
61 |
59 |
57 |
Marin County |
Marin |
846 |
52 |
55 |
57 |
San Leandro |
Alameda |
388 |
56 |
56 |
57 |
Albany |
Alameda |
59 |
58 |
57 |
56 |
East Palo Alto |
San Mateo |
80 |
53 |
55 |
56 |
Belmont |
San Mateo |
138 |
58 |
57 |
55 |
Moraga |
Contra Costa |
110 |
56 |
53 |
53 |
|
|
|
3-Year Moving Average |
||
Jurisdiction |
County |
Total |
2011 |
2012 |
2013 |
Poor (PCI=25–49) |
|||||
Vallejo |
Solano |
715 |
51 |
51 |
49 |
Orinda |
Contra Costa |
193 |
48 |
48 |
48 |
Petaluma |
Sonoma |
390 |
52 |
49 |
46 |
Sonoma County |
Sonoma |
2730 |
45 |
44 |
45 |
St. Helena |
Napa |
51 |
44 |
42 |
40 |
Larkspur |
Marin |
64 |
44 |
42 |
40 |
|
|||||
Regional |
|
42,867 |
66 |
66 |
66 |

![]()
info@mtc.ca.gov • Report Web site comments • Accessibility Information • Site Help
Metropolitan Transportation Commission • 101 Eighth Street, Oakland, California 94607
Phone:
(510) 817-5700, Fax: (510) 817-5848
For FasTrak® questions, contact the Customer Service Center: (877) 229-8655
This page was last modified Wednesday October 29, 2014
© 2015 MTC