Introduction :: SOUTH AFRICA
-
Dutch traders landed at the southern tip of modern day South Africa in 1652 and established a stopover point on the spice route between the Netherlands and the Far East, founding the city of Cape Town. After the British seized the Cape of Good Hope area in 1806, many of the Dutch settlers (Afrikaners, called "Boers" (farmers) by the British) trekked north to found their own republics in lands taken from the indigenous black inhabitants. The discovery of diamonds (1867) and gold (1886) spurred wealth and immigration and intensified the subjugation of the native inhabitants. The Afrikaners resisted British encroachments but were defeated in the Second South African War (1899-1902); however, the British and the Afrikaners, ruled together beginning in 1910 under the Union of South Africa, which became a republic in 1961 after a whites-only referendum. In 1948, the Afrikaner-dominated National Party was voted into power and instituted a policy of apartheid - the separate development of the races - which favored the white minority at the expense of the black majority. The African National Congress (ANC) led the opposition to apartheid and many top ANC leaders, such as Nelson MANDELA, spent decades in South Africa's prisons. Internal protests and insurgency, as well as boycotts by some Western nations and institutions, led to the regime's eventual willingness to negotiate a peaceful transition to majority rule. The first multi-racial elections in 1994 following the end of apartheid ushered in majority rule under an ANC-led government. South Africa has since struggled to address apartheid-era imbalances in decent housing, education, and health care. ANC infighting came to a head in 2008 when President Thabo MBEKI was recalled by Parliament, and Deputy President Kgalema MOTLANTHE, succeeded him as interim president. Jacob ZUMA became president after the ANC won general elections in 2009; he was reelected in 2014.
Geography :: SOUTH AFRICA
-
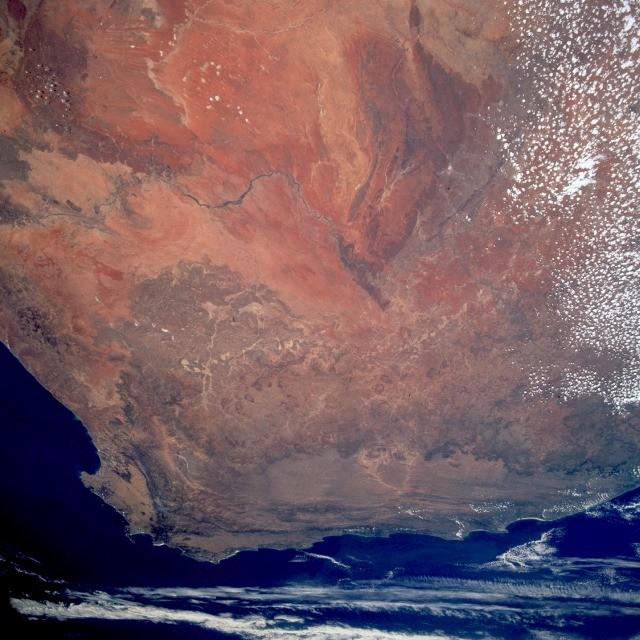
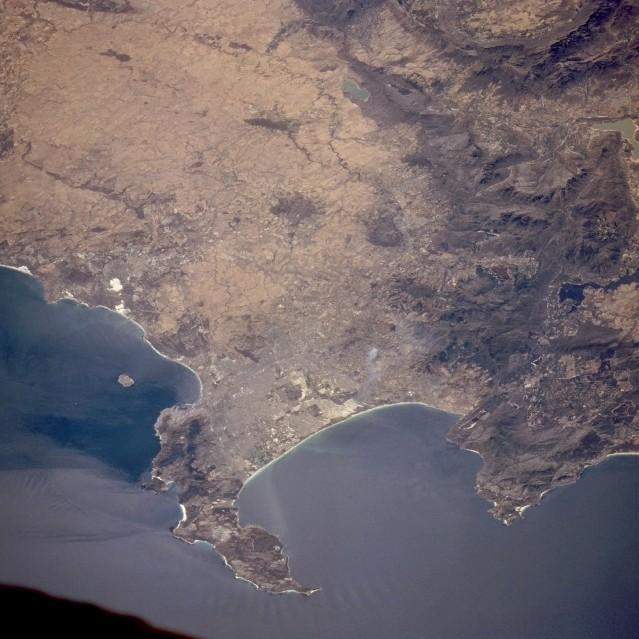
Southern Africa, at the southern tip of the continent of Africa
29 00 S, 24 00 E
Africa
total: 1,219,090 sq km
land: 1,214,470 sq km
water: 4,620 sq km
note: includes Prince Edward Islands (Marion Island and Prince Edward Island)
country comparison to the world: 25
slightly less than twice the size of Texas
Area comparison map:

Africa
::SOUTH AFRICA

Area Comparison
slightly less than twice the size of Texas
total: 5,244 km
border countries (6): Botswana 1,969 km, Lesotho 1,106 km, Mozambique 496 km, Namibia 1,005 km, Swaziland 438 km, Zimbabwe 230 km
2,798 km
territorial sea: 12 nm
contiguous zone: 24 nm
exclusive economic zone: 200 nm
continental shelf: 200 nm or to edge of the continental margin
mostly semiarid; subtropical along east coast; sunny days, cool nights
vast interior plateau rimmed by rugged hills and narrow coastal plain
mean elevation: 1,034 m
elevation extremes: lowest point: Atlantic Ocean 0 m
highest point: Njesuthi 3,408 m
gold, chromium, antimony, coal, iron ore, manganese, nickel, phosphates, tin, rare earth elements, uranium, gem diamonds, platinum, copper, vanadium, salt, natural gas
agricultural land: 79.4%
arable land 9.9%; permanent crops 0.3%; permanent pasture 69.2%
forest: 7.6%
other: 13% (2011 est.)
16,700 sq km (2012)
prolonged droughts
volcanism: the volcano forming Marion Island in the Prince Edward Islands, which last erupted in 2004, is South Africa's only active volcano
lack of important arterial rivers or lakes requires extensive water conservation and control measures; growth in water usage outpacing supply; pollution of rivers from agricultural runoff and urban discharge; air pollution resulting in acid rain; soil erosion; desertification
party to: Antarctic-Environmental Protocol, Antarctic-Marine Living Resources, Antarctic Seals, Antarctic Treaty, Biodiversity, Climate Change, Climate Change-Kyoto Protocol, Desertification, Endangered Species, Hazardous Wastes, Law of the Sea, Marine Dumping, Marine Life Conservation, Ozone Layer Protection, Ship Pollution, Wetlands, Whaling
signed, but not ratified: none of the selected agreements
South Africa completely surrounds Lesotho and almost completely surrounds Swaziland
People and Society :: SOUTH AFRICA
-
54,300,704
note: estimates for this country explicitly take into account the effects of excess mortality due to AIDS; this can result in lower life expectancy, higher infant mortality, higher death rates, lower population growth rates, and changes in the distribution of population by age and sex than would otherwise be expected (July 2016 est.)
country comparison to the world: 26
noun: South African(s)
adjective: South African
black African 80.2%, white 8.4%, colored 8.8%, Indian/Asian 2.5%
note: colored is a term used in South Africa, including on the national census, for persons of mixed race ancestry (2014 est.)
IsiZulu (official) 22.7%, IsiXhosa (official) 16%, Afrikaans (official) 13.5%, English (official) 9.6%, Sepedi (official) 9.1%, Setswana (official) 8%, Sesotho (official) 7.6%, Xitsonga (official) 4.5%, siSwati (official) 2.5%, Tshivenda (official) 2.4%, isiNdebele (official) 2.1%, sign language 0.5%, other 1.6% (2011 est.)
Protestant 36.6% (Zionist Christian 11.1%, Pentecostal/Charismatic 8.2%, Methodist 6.8%, Dutch Reformed 6.7%, Anglican 3.8%), Catholic 7.1%, Muslim 1.5%, other Christian 36%, other 2.3%, unspecified 1.4%, none 15.1% (2001 census)
South Africa’s youthful population is gradually aging, as the country’s total fertility rate (TFR) has declined dramatically from about 6 children per woman in the 1960s to roughly 2.2 in 2014. This pattern is similar to fertility trends in South Asia, the Middle East, and North Africa, and sets South Africa apart from the rest of sub-Saharan Africa, where the average TFR remains higher than other regions of the world. Today, South Africa’s decreasing number of reproductive age women is having fewer children, as women increase their educational attainment, workforce participation, and use of family planning methods; delay marriage; and opt for smaller families.
As the proportion of working-age South Africans has grown relative to children and the elderly, South Africa has been unable to achieve a demographic dividend because persistent high unemployment and the prevalence of HIV/AIDs have created a larger-than-normal dependent population. HIV/AIDS was also responsible for South Africa’s average life expectancy plunging to less than 43 years in 2008; it had only rebounded to approximately 50 years as of 2014. HIV/AIDS continues to be a serious public health threat, although awareness-raising campaigns and the wider availability of anti-retroviral drugs is stabilizing the number of new cases, enabling infected individuals to live longer, healthier lives, and reducing mother-child transmissions.
Migration to South Africa began in the second half of the 17th century when traders from the Dutch East India Company settled in the Cape and started using slaves from South and southeast Asia (mainly from India but also from present-day Indonesia, Bangladesh, Sri Lanka, and Malaysia) and southeast Africa (Madagascar and Mozambique) as farm laborers and, to a lesser extent, as domestic servants. The Indian subcontinent remained the Cape Colony’s main source of slaves in the early 18th century, while slaves were increasingly obtained from southeast Africa in the latter part of the 18th century and into the 19th century under British rule.
After slavery was completely abolished in the British Empire in 1838, South Africa’s colonists turned to temporary African migrants and indentured labor through agreements with India and later China, countries that were anxious to export workers to alleviate domestic poverty and overpopulation. Of the more than 150,000 indentured Indian laborers hired to work in Natal’s sugar plantations between 1860 and 1911, most exercised the right as British subjects to remain permanently (a small number of Indian immigrants came freely as merchants). Because of growing resentment toward Indian workers, the 63,000 indentured Chinese workers who mined gold in Transvaal between 1904 and 1911 were under more restrictive contracts and generally were forced to return to their homeland.
In the late 19th century and nearly the entire 20th century, South Africa’s then British colonies’ and Dutch states’ enforced selective immigration policies that welcomed “assimilable” white Europeans as permanent residents but excluded or restricted other immigrants. Following the Union of South Africa’s passage of a law in 1913 prohibiting Asian and other non-white immigrants and its elimination of the indenture system in 1917, temporary African contract laborers from neighboring countries became the dominant source of labor in the burgeoning mining industries. Others worked in agriculture and smaller numbers in manufacturing, domestic service, transportation, and construction. Throughout the 20th century, at least 40% of South Africa’s miners were foreigners; the numbers peaked at over 80% in the late 1960s. Mozambique, Lesotho, Botswana, and Swaziland were the primary sources of miners, and Malawi and Zimbabwe were periodic suppliers.
Under apartheid, a “two gates” migration policy focused on policing and deporting illegal migrants rather than on managing migration to meet South Africa’s development needs. The exclusionary 1991 Aliens Control Act limited labor recruitment to the highly skilled as defined by the ruling white minority, while bilateral labor agreements provided exemptions that enabled the influential mining industry and, to a lesser extent, commercial farms, to hire temporary, low-paid workers from neighboring states. Illegal African migrants were often tacitly allowed to work for low pay in other sectors but were always under threat of deportation.
The abolishment of apartheid in 1994 led to the development of a new inclusive national identity and the strengthening of the country’s restrictive immigration policy. Despite South Africa’s protectionist approach to immigration, the downsizing and closing of mines, and rising unemployment, migrants from across the continent believed that the country held work opportunities. Fewer African labor migrants were issued temporary work permits and, instead, increasingly entered South Africa with visitors’ permits or came illegally, which drove growth in cross-border trade and the informal job market. A new wave of Asian immigrants has also arrived over the last two decades, many operating small retail businesses.
In the post-apartheid period, increasing numbers of highly skilled white workers emigrated, citing dissatisfaction with the political situation, crime, poor services, and a reduced quality of life. The 2002 Immigration Act and later amendments were intended to facilitate the temporary migration of skilled foreign labor to fill labor shortages, but instead the legislation continues to create regulatory obstacles. Although the education system has improved and brain drain has slowed in the wake of the 2008 global financial crisis, South Africa continues to face skills shortages in several key sectors, such as health care and technology.
South Africa’s stability and economic growth has acted as a magnet for refugees and asylum seekers from nearby countries, despite the prevalence of discrimination and xenophobic violence. Refugees have included an estimated 350,000 Mozambicans during its 1980s civil war and, more recently, several thousand Somalis, Congolese, and Ethiopians. Nearly all of the tens of thousands of Zimbabweans who have applied for asylum in South Africa have been categorized as economic migrants and denied refuge.
0-14 years: 28.34% (male 7,718,511/female 7,667,830)
15-24 years: 18.07% (male 4,865,807/female 4,943,707)
25-54 years: 41.44% (male 11,372,944/female 11,130,874)
55-64 years: 6.59% (male 1,662,874/female 1,915,908)
65 years and over: 5.57% (male 1,269,551/female 1,752,698) (2016 est.)
population pyramid:

Africa
::SOUTH AFRICA
Population Pyramid
A population pyramid illustrates the age and sex structure of a country's population and may provide insights about political and social stability, as well as economic development. The population is distributed along the horizontal axis, with males shown on the left and females on the right. The male and female populations are broken down into 5-year age groups represented as horizontal bars along the vertical axis, with the youngest age groups at the bottom and the oldest at the top. The shape of the population pyramid gradually evolves over time based on fertility, mortality, and international migration trends.
For additional information, please see the entry for Population pyramid on the Definitions and Notes page under the References tab.
total dependency ratio: 52.1%
youth dependency ratio: 44.5%
elderly dependency ratio: 7.7%
potential support ratio: 13.1% (2015 est.)
total: 26.8 years
male: 26.5 years
female: 27 years (2016 est.)
country comparison to the world: 145
0.99% (2016 est.)
country comparison to the world: 116
20.5 births/1,000 population (2016 est.)
country comparison to the world: 79
9.6 deaths/1,000 population (2016 est.)
country comparison to the world: 51
-0.9 migrant(s)/1,000 population (2016 est.)
country comparison to the world: 140
urban population: 64.8% of total population (2015)
rate of urbanization: 1.59% annual rate of change (2010-15 est.)
Johannesburg (includes Ekurhuleni) 9.399 million; Cape Town (legislative capital) 3.66 million; Durban 2.901 million; PRETORIA (capital) 2.059 million; Port Elizabeth 1.179 million; Vereeniging 1.155 million (2015)
at birth: 1.02 male(s)/female
0-14 years: 1.01 male(s)/female
15-24 years: 0.98 male(s)/female
25-54 years: 1.02 male(s)/female
55-64 years: 0.87 male(s)/female
65 years and over: 0.73 male(s)/female
total population: 0.98 male(s)/female (2016 est.)
138 deaths/100,000 live births (2015 est.)
country comparison to the world: 38
total: 32 deaths/1,000 live births
male: 35.5 deaths/1,000 live births
female: 28.4 deaths/1,000 live births (2016 est.)
country comparison to the world: 63
total population: 63.1 years
male: 61.6 years
female: 64.6 years (2016 est.)
country comparison to the world: 190
2.31 children born/woman (2016 est.)
country comparison to the world: 89
8.8% of GDP (2014)
country comparison to the world: 42
0.78 physicians/1,000 population (2013)
improved:
urban: 99.6% of population
rural: 81.4% of population
total: 93.2% of population
unimproved:
urban: 0.4% of population
rural: 18.6% of population
total: 6.8% of population (2015 est.)
improved:
urban: 69.6% of population
rural: 60.5% of population
total: 66.4% of population
unimproved:
urban: 30.4% of population
rural: 39.5% of population
total: 33.6% of population (2015 est.)
19.2% (2015 est.)
country comparison to the world: 4
6,984,600 (2015 est.)
country comparison to the world: 1
182,400 (2015 est.)
country comparison to the world: 2
degree of risk: intermediate
food or waterborne diseases: bacterial diarrhea, hepatitis A, and typhoid fever
water contact disease: schistosomiasis (2016)
25.6% (2014)
country comparison to the world: 24
8.7% (2008)
country comparison to the world: 72
6.1% of GDP (2014)
country comparison to the world: 42
definition: age 15 and over can read and write
total population: 94.3%
male: 95.5%
female: 93.1% (2015 est.)
total: 13 years
male: 12 years
female: 14 years (2013)
total: 51.3%
male: 48%
female: 55.3% (2014 est.)
country comparison to the world: 6
Government :: SOUTH AFRICA
-
conventional long form: Republic of South Africa
conventional short form: South Africa
former: Union of South Africa
abbreviation: RSA
etymology: self-descriptive name from the country's location on the continent; "Africa" is derived from the Roman designation of the area corresponding to present-day Tunisia "Africa terra," which meant "Land of the Afri" (the tribe resident in that area), but which eventually came to mean the entire continent
parliamentary republic
name: Pretoria (administrative capital); Cape Town (legislative capital); Bloemfontein (judicial capital)
geographic coordinates: 25 42 S, 28 13 E
time difference: UTC+2 (7 hours ahead of Washington, DC, during Standard Time)
9 provinces; Eastern Cape, Free State, Gauteng, KwaZulu-Natal, Limpopo, Mpumalanga, Northern Cape, North West, Western Cape
31 May 1910 (Union of South Africa formed from four British colonies: Cape Colony, Natal, Transvaal, and Orange Free State); 31 May 1961 (republic declared); 27 April 1994 (majority rule)
Freedom Day, 27 April (1994)
several previous; latest drafted 8 May 1996, approved 4 December 1996, effective 4 February 1997; amended many times, last in 2013 (2016)
mixed legal system of Roman-Dutch civil law, English common law, and customary law
has not submitted an ICJ jurisdiction declaration; accepts ICCt jurisdiction
citizenship by birth: no
citizenship by descent only: at least one parent must be a citizen of South Africa
dual citizenship recognized: yes, but requires prior permission of the government
residency requirement for naturalization: 1 year
18 years of age; universal
chief of state: President Jacob ZUMA (since 9 May 2009); Deputy President Matamela Cyril RAMAPHOSA (since 26 May 2014) note - the president is both chief of state and head of government
head of government: President Jacob ZUMA (since 9 May 2009); Deputy President Matamela Cyril RAMAPHOSA (since 26 May 2014)
cabinet: Cabinet appointed by the president
elections/appointments: president indirectly elected by the National Assembly for a 5-year term (eligible for a second term); election last held on 21 May 2014 (next to be held in May 2019)
election results: Jacob ZUMA (ANC) reelected president by the National Assembly unopposed
description: bicameral Parliament consists of the National Council of Provinces (90 seats; 10-member delegations appointed by each of the 9 provincial legislatures to serve 5-year terms; note - this council has special powers to protect regional interests, including safeguarding cultural and linguistic traditions among ethnic minorities) and the National Assembly (400 seats; members directly elected in multi-seat constituencies by proportional representation vote to serve 5-year terms)
elections: National Assembly and National Council of Provinces - last held on 7 May 2014 (next to be held in 2019)
election results: National Council of Provinces - percent of vote by party - NA; seats by party - ANC 60, DA 20, EFF 7, IFP 1, NFP 1, UDM 1; National Assembly - percent of vote by party - ANC 62.2%, DA 22.2%, EFF 6.4%, IFP 2.4%, NFP 1.6%, UDM 1.0%, other 4.2%; seats by party - ANC 249, DA 89, EFF 25, IFP 10, NFP 6, UDM 4, other 17
highest court(s): Supreme Court of Appeals (consists of the court president, deputy president, and 21 judges); Constitutional Court (consists of the chief and deputy chief justices and 9 judges)
judge selection and term of office: Supreme Court of Appeals president and vice-president appointed by the national president after consultation with the Judicial Services Commission (JSC), a 23-member body chaired by the chief justice and includes other judges and judicial executives, members of parliament, practicing lawyers and advocates, a teacher of law, and several members designated by the national president; other Supreme Court judges appointed by the national president on the advice of the JSC and hold office until discharged from active service by terms of an Act of Parliament; Constitutional Court chief and deputy chief justices appointed by the national president after consultation with the JSC and with heads of the National Assembly; other Constitutional Court judges appointed by the national president after consultation with the chief justice and leaders of the National Assembly; Constitutional Court judges appointed for 12-year non-renewable terms or until age 70
subordinate courts: High Courts; Magistrates' Courts; labor courts; land claims courts
African Christian Democratic Party or ACDP [Kenneth MESHOE]
African Independent Congress or AIC [Mandla GALD]
African National Congress or ANC [Jacob ZUMA]
African People's Convention or APC [Themba GODI]
Agamg SA [Mike Tshishonga, acting]
Congress of the People or COPE [Mosiuoa LEKOTA]
Democratic Alliance or DA [Mmusi MAIMANE]
Economic Freedom Fighters or EFF [Julius MALEMA]
Freedom Front Plus or FF+ [Pieter MULDER]
Inkatha Freedom Party or IFP [Mangosuthu BUTHELEZI]
National Freedom Party or NFP [Zanele kaMAGWAZA-MSIBI]
Pan-Africanist Congress of Azania or PAC [Luthanado MBINDA]
United Christian Democratic Party or UCDP [Isaac Sipho MFUNDISI]
United Democratic Movement or UDM [Bantu HOLOMISA]
Congress of South African Trade Unions or COSATU [Zwelinzima VAVI, general secretary]
South African Communist Party or SACP [Blade NZIMANDE, general secretary]
South African National Civic Organization or SANCO [Richard MDAKANE, national president]
note: COSATU and SACP are in a formal alliance with the African National Congress
ACP, AfDB, AU, BIS, BRICS, C, CD, FAO, FATF, G-20, G-24, G-5, G-77, IAEA, IBRD, ICAO, ICC (national committees), ICCt, ICRM, IDA, IFAD, IFC, IFRCS, IHO, ILO, IMF, IMO, IMSO, Interpol, IOC, IOM, IPU, ISO, ITSO, ITU, ITUC (NGOs), MIGA, MONUSCO, NAM, NSG, OECD (Enhanced Engagement, OPCW, Paris Club (associate), PCA, SACU, SADC, UN, UNAMID, UNCTAD, UNESCO, UNHCR, UNIDO, UNITAR, UNWTO, UPU, WCO, WFTU (NGOs), WHO, WIPO, WMO, WTO, ZC
chief of mission: Ambassador Mninwa Johnnes MAHLANGU (since 23 February 2015)
chancery: 3051 Massachusetts Avenue NW, Washington, DC 20008
telephone: [1] (202) 232-4400 [1] (202) 232-4400
FAX: [1] (202) 265-1607
consulate(s) general: Chicago, Los Angeles, New York
chief of mission: Ambassador Patrick Hubert GASPARD (since 16 October 2013)
embassy: 877 Pretorius Street, Arcadia, Pretoria
mailing address: P.O. Box 9536, Pretoria 0001
telephone: [27] (12) 431-4000
FAX: [27] (12) 342-2299
consulate(s) general: Cape Town, Durban, Johannesburg
two equal width horizontal bands of red (top) and blue separated by a central green band that splits into a horizontal Y, the arms of which end at the corners of the hoist side; the Y embraces a black isosceles triangle from which the arms are separated by narrow yellow bands; the red and blue bands are separated from the green band and its arms by narrow white stripes; the flag colors do not have any official symbolism, but the Y stands for the "convergence of diverse elements within South African society, taking the road ahead in unity"; black, yellow, and green are found on the flag of the African National Congress, while red, white, and blue are the colors in the flags of the Netherlands and the UK, whose settlers ruled South Africa during the colonial era
note: the South African flag is one of only two national flags to display six colors as part of its primary design, the other is South Sudan's
springbok (antelope), king protea flower; national colors: red, green, blue, yellow, black, white
name: "National Anthem of South Africa"
lyrics/music: Enoch SONTONGA and Cornelius Jacob LANGENHOVEN/Enoch SONTONGA and Marthinus LOURENS de Villiers
note: adopted 1994; a combination of "N'kosi Sikelel' iAfrica" (God Bless Africa) and "Die Stem van Suid Afrika" (The Call of South Africa), which were respectively the anthems of the non-white and white communities under apartheid; official lyrics contain a mixture of Xhosa, Zulu, Sesotho, Afrikaans, and English (i.e., the five most widely spoken of South Africa's 11 official languages); music incorporates the melody used in the Tanzanian and Zambian anthems
Economy :: SOUTH AFRICA
-
South Africa is a middle-income emerging market with an abundant supply of natural resources; well-developed financial, legal, communications, energy, and transport sectors; and a stock exchange that is Africa’s largest and among the top 20 in the world.
Economic growth has decelerated in recent years, slowing to just 1.5% in 2014. Unemployment, poverty, and inequality - among the highest in the world - remain a challenge. Official unemployment is roughly 25% of the workforce, and runs significantly higher among black youth. Even though the country's modern infrastructure supports a relatively efficient distribution of goods to major urban centers throughout the region, unstable electricity supplies retard growth. Eskom, the state-run power company, is building three new power stations and is installing new power demand management programs to improve power grid reliability. Load shedding and resulting rolling blackouts gripped many parts of South Africa in late 2014 and early 2015 because of electricity supply constraints due to technical problems at some generation units, unavoidable planned maintenance, and an accident at a power station in Mpumalanga province. The rolling blackouts were the worst the country faced since 2008. Construction delays at two additional plants, however, mean South Africa will continue to operate on a razor thin margin; economists judge that growth cannot exceed 3% until electrical supply problems are resolved.
South Africa's economic policy has focused on controlling inflation; however, the country faces structural constraints that also limit economic growth, such as skills shortages, declining global competitiveness, and frequent work stoppages due to strike action. The current government faces growing pressure from urban constituencies to improve the delivery of basic services to low-income areas and to increase job growth.
$736.3 billion (2016 est.)
$735.4 billion (2015 est.)
$726.3 billion (2014 est.)
note: data are in 2016 dollars
country comparison to the world: 31
$280.4 billion (2015 est.)
0.1% (2016 est.)
1.3% (2015 est.)
1.6% (2014 est.)
country comparison to the world: 191
$13,200 (2016 est.)
$13,400 (2015 est.)
$13,400 (2014 est.)
note: data are in 2016 dollars
country comparison to the world: 119
16.3% of GDP (2016 est.)
16.4% of GDP (2015 est.)
15.5% of GDP (2014 est.)
country comparison to the world: 109
household consumption: 58%
government consumption: 19.9%
investment in fixed capital: 20.1%
investment in inventories: 0.5%
exports of goods and services: 34.9%
imports of goods and services: -33.4% (2016 est.)
agriculture: 2.2%
industry: 29.2%
services: 68.7% (2016 est.)
corn, wheat, sugarcane, fruits, vegetables; beef, poultry, mutton, wool, dairy products
mining (world's largest producer of platinum, gold, chromium), automobile assembly, metalworking, machinery, textiles, iron and steel, chemicals, fertilizer, foodstuffs, commercial ship repair
-1% (2016 est.)
country comparison to the world: 181
21.7 million (2016 est.)
country comparison to the world: 30
agriculture: 4%
industry: 18%
services: 66% (2014 est.)
26.8% (2016 est.)
25.4% (2015 est.)
country comparison to the world: 182
35.9% (2012 est.)
lowest 10%: 1.2%
highest 10%: 51.7% (2009 est.)
62.5 (2013 est.)
59.3 (1994)
country comparison to the world: 2
revenues: $76.62 billion
expenditures: $86.45 billion (2016 est.)
27.3% of GDP (2016 est.)
country comparison to the world: 96
-3.5% of GDP (2016 est.)
country comparison to the world: 123
43.3% of GDP (2016 est.)
44.4% of GDP (2015 est.)
country comparison to the world: 109
1 April - 31 March
6.5% (2016 est.)
4.5% (2015 est.)
country comparison to the world: 183
5.75% (31 December 2014)
7% (31 December 2009)
country comparison to the world: 70
10.6% (31 December 2016 est.)
9.42% (31 December 2015 est.)
country comparison to the world: 77
$99.49 billion (31 December 2016 est.)
$91.72 billion (31 December 2015 est.)
country comparison to the world: 36
$172.7 billion (31 December 2015 est.)
$192.9 billion (31 December 2014 est.)
country comparison to the world: 46
$209 billion (31 December 2016 est.)
$196.6 billion (31 December 2015 est.)
country comparison to the world: 45
$735.9 billion (31 December 2015 est.)
$933.9 billion (31 December 2014 est.)
$942.8 billion (31 December 2013 est.)
country comparison to the world: 16
-$9.382 billion (2016 est.)
-$13.67 billion (2015 est.)
country comparison to the world: 177
$83.16 billion (2016 est.)
$81.63 billion (2015 est.)
country comparison to the world: 39
gold, diamonds, platinum, other metals and minerals, machinery and equipment
China 11.3%, US 7.3%, Germany 6%, Namibia 5.2%, Botswana 5.2%, Japan 4.7%, UK 4.3%, India 4.2% (2015)
$85.03 billion (2016 est.)
$84.33 billion (2015 est.)
country comparison to the world: 36
machinery and equipment, chemicals, petroleum products, scientific instruments, foodstuffs
China 17.6%, Germany 11.2%, US 6.7%, Nigeria 5%, India 4.7%, Saudi Arabia 4.1% (2015)
$44.6 billion (31 December 2016 est.)
$45.91 billion (31 December 2015 est.)
country comparison to the world: 40
$129.7 billion (31 December 2016 est.)
$131.7 billion (31 December 2015 est.)
country comparison to the world: 44
$128.3 billion (31 December 2016 est.)
$124.9 billion (31 December 2015 est.)
country comparison to the world: 43
$168.2 billion (31 December 2016 est.)
$162.8 billion (31 December 2015 est.)
country comparison to the world: 27
rand (ZAR) per US dollar -
15.7 (2016 est.)
12.7581 (2015 est.)
12.7581 (2014 est.)
10.8469 (2013 est.)
8.2 (2012 est.)
Energy :: SOUTH AFRICA
-
235 billion kWh (2014 est.)
country comparison to the world: 20
212 billion kWh (2014 est.)
country comparison to the world: 20
14 billion kWh (2014 est.)
country comparison to the world: 15
11 billion kWh (2014 est.)
country comparison to the world: 23
46 million kW (2014 est.)
country comparison to the world: 23
90.4% of total installed capacity (2013 est.)
country comparison to the world: 74
4.4% of total installed capacity (2013 est.)
country comparison to the world: 25
4.5% of total installed capacity (2013 est.)
country comparison to the world: 128
0.7% of total installed capacity (2013 est.)
country comparison to the world: 101
3,000 bbl/day (2015 est.)
country comparison to the world: 86
0 bbl/day (2013 est.)
country comparison to the world: 119
466,100 bbl/day (2013 est.)
country comparison to the world: 21
15 million bbl (1 January 2016 es)
country comparison to the world: 86
488,200 bbl/day (2013 est.)
country comparison to the world: 36
663,000 bbl/day (2014 est.)
country comparison to the world: 31
131,500 bbl/day (2013 est.)
country comparison to the world: 44
169,900 bbl/day (2013 est.)
country comparison to the world: 36
950 million cu m (2014 est.)
country comparison to the world: 64
4.75 billion cu m (2014 est.)
country comparison to the world: 59
0 cu m (2013 est.)
country comparison to the world: 94
3.8 billion cu m (2014 est.)
country comparison to the world: 37
15.01 billion cu m (1 January 2012 es)
country comparison to the world: 77
482 million Mt (2013 est.)
country comparison to the world: 14
Communications :: SOUTH AFRICA
-
total subscriptions: 4,131,055
subscriptions per 100 inhabitants: 8 (July 2015 est.)
country comparison to the world: 40
total: 85.197 million
subscriptions per 100 inhabitants: 159 (July 2015 est.)
country comparison to the world: 19
general assessment: the system is the best-developed and most modern in Africa
domestic: combined fixed-line and mobile-cellular teledensity is roughly 165 telephones per 100 persons; consists of carrier-equipped open-wire lines, coaxial cables, microwave radio relay links, fiber-optic cable, radiotelephone communication stations, and wireles
international: country code - 27; the SAT-3/WASC and SAFE fiber-optic submarine cable systems connect South Africa to Europe and Asia; the EASSy fiber-optic cable system connects with Europe and North America; satellite earth stations - 3 Intelsat (1 Indian Ocean and 2 (2015)
the South African Broadcasting Corporation (SABC) operates 4 TV stations, 3 are free-to-air and 1 is pay TV; e.tv, a private station, is accessible to more than half the population; multiple subscription TV services provide a mix of local and internationa (2007)
.za
total: 27.868 million
percent of population: 51.9% (July 2015 est.)
country comparison to the world: 24
Transportation :: SOUTH AFRICA
-
number of registered air carriers: 23
inventory of registered aircraft operated by air carriers: 216
annual passenger traffic on registered air carriers: 17,188,887
annual freight traffic on registered air carriers: 885,277,991 mt-km (2015)
ZS (2016)
566 (2013)
country comparison to the world: 11
total: 144
over 3,047 m: 11
2,438 to 3,047 m: 7
1,524 to 2,437 m: 52
914 to 1,523 m: 65
under 914 m: 9 (2013)
total: 422
2,438 to 3,047 m: 1
1,524 to 2,437 m: 31
914 to 1,523 m: 258
under 914 m: 132 (2013)
1 (2013)
condensate 94 km; gas 1,293 km; oil 992 km; refined products 1,460 km (2013)
total: 20,986 km
standard gauge: 80 km 1.435-m gauge (80 km electrified)
narrow gauge: 19,756 km 1.065-m gauge (8,271 km electrified)
other: 1,150 km (passenger rail, gauge unspecified, 1,115.5 km electrified) (2014)
country comparison to the world: 13
total: 747,014 km
paved: 158,952 km
unpaved: 588,062 km (2014)
country comparison to the world: 10
total: 3
by type: petroleum tanker 3
registered in other countries: 19 (Australia 1, Isle of Man 2, Mexico 1, NZ 1, Seychelles 1, Singapore 13) (2010)
country comparison to the world: 136
major seaport(s): Cape Town, Durban, Port Elizabeth, Richards Bay, Saldanha Bay
container port(s) (TEUs): Durban (2,712,975)
LNG terminal(s) (import): Mossel Bay
Military and Security :: SOUTH AFRICA
-
South African National Defense Force (SANDF): South African Army, South African Navy (SAN), South African Air Force (SAAF), South African Military Health Services (2013)
18 years of age for voluntary military service; women are eligible to serve in noncombat roles; 2-year service obligation (2012)
1.2% of GDP (2014)
1% of GDP (2013)
1.16% of GDP (2012)
1.14% of GDP (2011)
1.16% of GDP (2010)
country comparison to the world: 100
with the end of apartheid and the establishment of majority rule, former military, black homelands forces, and ex-opposition forces were integrated into the South African National Defense Force (SANDF)
Transnational Issues :: SOUTH AFRICA
-
South Africa has placed military units to assist police operations along the border of Lesotho, Zimbabwe, and Mozambique to control smuggling, poaching, and illegal migration; the governments of South Africa and Namibia have not signed or ratified the text of the 1994 Surveyor's General agreement placing the boundary in the middle of the Orange River
refugees (country of origin): 41,458 (Somalia); 32,582 (Democratic Republic of the Congo); 20,324 (Ethiopia); 6,566 (Republic of the Congo); 6,358 (Zimbabwe) (2015)
transshipment center for heroin, hashish, and cocaine, as well as a major cultivator of marijuana in its own right; cocaine and heroin consumption on the rise; world's largest market for illicit methaqualone, usually imported illegally from India through various east African countries, but increasingly producing its own synthetic drugs for domestic consumption; attractive venue for money launderers given the increasing level of organized criminal and narcotics activity in the region and the size of the South African economy