جمعہ 17 اپریل 2009Friday, April 17, 2009
Taxi To the Dark Side
We saw Taxi to the Dark Side quite some time ago.
It’s a great documentary about the torture that the US government engaged in when George W Bush was President. The main focus of the documentary is a young Afghan taxi driver, Dilawar, who was stopped at a checkpoint in Afghanistan and then jailed at Bagram by the US military. There he was interrogated and tortured. And finally murdered by US military and intelligence personnel.
The movie also goes into the torture policies of the Bush administration and how they were applied in Guantanamo, Iraq, Afghanistan and various other black sites around the world.
The torture stories are hair raising and it has been clear for some time that the the use of torture was a deliberate policy approved at the highest levels of the Bush administration. However, I felt it difficult to say much about the documentary other than ranting against the war crimes and inhumanity of the previous administration. Thus this review lingered in draft status for a while. After all, what more could I write since I have written multiple times about torture during the past six years.
However, there have been some recent developments since Barack Obama became President. He has released a number of Justice Department memos related to the torture policy which you can read at the ACLU site. All memos are worth reading but if you must read just one excerpt, as Glenn Greenwald says, it should be this one from the May 10, 2005 memo by Steven Bradbury, Acting Assistant Attorney General, OLC, to John A. Rizzo, General Counsel CIA:
State Department Reports. Each year, in the State Department’s Country Reports on Human Rights Practices, the United States condemns coercive interrogation techniques and other practices employed by other countries. Certain of the techniques the United States has condemned appear to bear some resemblance to some of the CIA interrogation techniques. In their discussion of Indonesia, for example, the reports lists as “[p]sychological torture” conduct that involves “food and sleep deprivation,” but give no specific information as to what these techniques involve. In their discussion of Egypt, the reports list as “methods of torture” “stripping and blindfolding victims; suspending victims from a ceiling or doorframe with feet just touching the floor; beating victims [with various objects]; … and dousing vitims with cold water.” See also, e.g., Algeria (describing the “chiffon” method, which involves “placing a rag drenched in dirty water in someone’s mouth”); Iran (counting sleep deprivation as either torture or severe prisoner abuse); Syria (discussing sleep deprivation and “having cold water thrown on” detainees as either torture or “ill-treatment). The State Department’s inclusion of nudity, water dousing, sleep deprivation, and food deprivation among the conduct it condemns is significant and provides some indication of an executive foreign relations tradition condemning the use of these techniques.
[…]
A United States foreign relations tradition of condemning torture, the indiscriminate use of force, the use of force against the government’s political opponents, or the use of force to obtain confessions in ordinary criminal cases says little about the propriety of the CIA’s interrogation practices. The CIA’s careful screening procedures are designed to ensure that enhanced techniques are used in the relatively few interrogations of terrorists who are believed to possess vital, actionable intelligence that might avert an attack against the United States or its interests. The CIA uses enhanced techniques only to the extent reasonably believed necessary to obtain information and takes great care to avoid inflicting severe pain or suffering or any lasting or unnecesary harm. In short, the CA program is designed to subject detainees to no more duress than is justified by the Government’s interest in protecting the United States from further terrorist attacks. In these essential respects, it differs from the conduct condemned in the State Department reports.
In other words, it’s not torture when we do the same things that we condemn as torture when done by others.
There was also an International Committee of the Red Cross Report on torture that came out recently, some excerpts of which are given here and some analysis is here.
If you are interested in my blog posts on torture, here they are:
- Torture
- Torture Again
- Torture, Emperor and Forgetfulness
- Do They Look Like Me?
- Legal Torture
- Reaction to Criticism
- Pro-Torture Senators or the Nazgul?
- Empire and Torture
- War Crimes and Military Justice
- Rendition
- Rendition and Torture
- Torture and Public Opinion
In addition, I have been collecting links to stories, memos and reports about torture (and other topics) in my Browsing list, recent entries of which are shown on the sidebar on the main page. Let’s collect those links (that are not dead) here as well.
- Torture at Abu Ghraib
- Taguba Report on Iraqi Prisoner Abuse
- Torture, Black Ops and More
- Making Torture Legal
- HRW Report: The Road to Abu Ghraib
- Tipton Three in Gitmo
- Doctors and Torture
- Abu Ghraib: The Hidden Story
- Broad Use of Harsh Tactics at Gitmo
- The Road to Abu Ghraib
- How Dubious Evidence Spurred Relentless Guantánamo Spy Hunt
- Atrocities in Plain Sight
- Outsourcing Torture
- We don’t torture people; we send them where they can be boiled alive
- Brutal Death of 2 Afghan Inmates at Bagram
- A Deadly Interrogation
- HRW:Firsthand Accounts of Torture of Iraqi Detainees
- HRW: Soldiers’ Accounts of Detainee Abuse in Iraq
- HRW: Ghost Prisoner: Two Years in Secret CIA Detention
- General Taguba and his report on torture
- Council of Europe Report on CIA Black Sites
- Cheney and Torture
- How Psychologists abetted Bush’s torture policy
- CIA’s Black Sites
- A Review of the FBI’s Involvement in and Observations of Detainee Interrogations in Guantanamo Bay, Afghanistan, and Iraq
- Ghost Prisoners and Torture
- Is There a Nexus between Torture and Radicalization?
- The Battle for a Country’s Soul
- Official American Sadism
- Confessions of a former Guantánamo prosecutor
- Senate Armed Services Committee Report of its Inquiry into the Treatment of Detainees in U.S. Custody
- A Pakistani Ex-Detainee of the U.S. Describes a 6-Year Ordeal
Oh I forgot to rate the documentary. It’s a must-see, so 10/10.
By Zack at 4:59 PM in Civil Liberties , International Affairs , Movies | Comments (0) | TrackBack (0)
اتوار 22 مارچ 2009Sunday, March 22, 2009
Buy a House, Get a Green Card?
Last month, Thomas Friedman wrote in the New York Times that:
Leave it to a brainy Indian to come up with the cheapest and surest way to stimulate our economy: immigration.
“All you need to do is grant visas to two million Indians, Chinese and Koreans,” said Shekhar Gupta, editor of The Indian Express newspaper. “We will buy up all the subprime homes. We will work 18 hours a day to pay for them. We will immediately improve your savings rate — no Indian bank today has more than 2 percent nonperforming loans because not paying your mortgage is considered shameful here. And we will start new companies to create our own jobs and jobs for more Americans.”
Alex Tabarrok called it the “buy a house, get a visa” strategy and claimed that:
the multiplier on the “buy a house, get a visa” strategy would be much larger than any possible domestic multiplier since the money would come from outside the economy (and efficiency would improve as well.)
An op-ed in the Wall Street Journal has now suggested the same.
The Obama administration should seriously consider granting resident status to foreigners who buy surplus houses in this country.
[…] A better idea is to offer permanent residence status to the many foreigners who are clamoring to get into the U.S. – if they buy houses of minimal values (not shacks). They wouldn’t need to live in those houses, but in order to remove the unit from the total housing market, they couldn’t rent them. Their temporary resident status granted upon purchase would become permanent after, perhaps, five years, if they still owned the houses and maintained clean records. The mere announcement of this program might well stop the ongoing collapse in house prices, especially in cities such as Las Vegas, Miami, Phoenix and San Francisco, where prices are down 40% – but where many foreigners like to live.
Each year, 85,000 H-1B visas are granted for foreigners with advanced skills and education, and last year, 163,000 petitions were filed in the first five days after applications were accepted. The Ewing Marion Kauffman Foundation estimates that as of Sept. 30, 2006, 500,040 residents of the U.S. and 59,915 individuals living abroad were waiting for employment-based visas. Many would buy homes if their immigration conditions were settled.
[…] The blueprint for a program to sell surplus housing to immigrants is already in place with the EB-5 visa program. Each year, 10,000 EB-5 visas for this country are available for foreigners who each invest $1 million in a new enterprise ($500,000 in economically depressed areas) that creates at least 10 full-time jobs. After two years, the entrepreneur and his family can become permanent residents.
Of course, Alex Tabarrok liked it while Matthew Yglesias says:
I don’t think this idea is nearly the panacea that Gary Shilling and Richard LeFrak seem to think it is, but nevertheless a program to offer permanent resident status to foreigners who buy American houses does seem to me like a good idea.
John Mauldin goes completely overboard:
Let’s assume one million new immigrants would buy homes. At an average price of almost $200,000, that would be $200 billion injected into the economy. And each of those homes has to be furnished, food has to be bought, clothing will be needed, local taxes will be paid. Airplane tickets to research potential areas, hotels needed during the interim period, and other related expenditures would add up. Over two years, this could easily be another $100 billion.
I am not an economist and I’ll leave it to economists to discuss the multiplier and stimulative effects of this program. However, I am an immigrant and have looked at the immigration details in the US fairly extensively.
Let’s first look at the average number of immigrants per year to the US in the period 1998-2007: 935,948. It reached a peak of 1,266,129 in 2006 but was down to 1,052,415 in 2007. When 2008 data comes out, it is expected to go down further because of the economic conditions.
Contrary to Mauldin, these one million immigrants won’t all buy houses since the number of households is less than a million. The average household size in the US is 2.61. I remember reading that immigrant household size is larger but I can’t find that data right now, so using the US number, we get only about 400,000 households.
Before you start liking the 400,000 households number, remember that a majority (621,047 in 2007) of the immigrants were adjusting status, i.e. they were already in the US. At least some of those already bought a house since they were planning to immigrate. I know lots of H-1B visa holders who bought houses and later adjusted to permanent resident status.
The Wall Street Journal op-ed mentions an already existing investor immigrant program EB-5. Let’s look at its conditions:
10,000 immigrant visas per year are available to qualified individuals seeking permanent resident status on the basis of their engagement in a new commercial enterprise.
Of the 10,000 investor visas (i.e., EB-5 visas) available annually, 5,000 are set aside for those who apply under a pilot program involving an USCIS-designated Regional Center.
In general, “eligible individuals” include those
- Who establish a new commercial enterprise by:
- Creating an original business;
- Purchasing an existing business and simultaneously or subsequently restructuring or reorganizing the business such that a new commercial enterprise results; or
- Expanding an existing business by 140 percent of the pre-investment number of jobs or net worth, or retaining all existing jobs in a troubled business that has lost 20 percent of its net worth over the past 12 to 24 months; and
- Who have invested – or who are actively in the process of investing – in a new commercial enterprise:
- At least $1,000,000, or
- At least $500,000 where the investment is being made in a “targeted employment area,” which is an area that has experienced unemployment of at least 150 per cent of the national average rate or a rural area as designated by OMB; and
- Whose engagement in a new commercial enterprise will benefit the United States economy and
- Create full-time employment for not fewer than 10 qualified individuals; or
- Maintain the number of existing employees at no less than the pre-investment level for a period of at least two years, where the capital investment is being made in a “troubled business,” which is a business that has been in existence for at least two years and that has lost 20 percent of its net worth over the past 12 to 24 months.
Now this EB-5 might have requirements that are too onerous and it’s always possible that the optimal investment is less than a million dollars and other conditions should be relaxed as well.
However, let us look at the number of immigrants admitted to the US under this program. The average number of EB-5 visas per year in the period 1998-2007 was 375. In 2007, the number of investor visas used was 806. This is not the number of investors, but of visas which includes family too. Let’s break down the numbers for 2007.
| Adjustment of Status | New Arrivals | Total | |
|---|---|---|---|
| Total EB-5 | 315 | 491 | 806 |
| Investors | 116 | 163 | 279 |
| Spouses & children | 187 | 328 | 515 |
As you can see, 10,000 visas per year were reserved for this investor program, but in the maximum used was about 8% of that. And the actual number of investors (not including dependents) in 2007 was only 279. Assuming the buy a house, get a green card program does a level of magnitude better because median house price (for 2005-7) is only about 181,800. Still, it would attract only about 3000 investors and their families. That would not do anything to the housing market or the US economy.
PS. The immigration numbers are from the 2007 Yearbook of Immigration Statistics, specifically Table 6 and Table 7.
By Zack at 3:24 PM in Economy , Immigration | Comments (3) | TrackBack (0)
جمعرات 5 مارچ 2009Thursday, March 05, 2009
Homosexual Marriage: Civil Right of Self-Interest?
The debate over homosexual marriage is simmering again in California. Opponents of Proposition 8 are making their case in the California Courts, arguing that California’s recent constitutional amendment violates the civil rights of those engaged in homosexual practices.
To gain clarity on this discussion, one can put it in a different context. Consider a sandwich shop on Crow Street, U.S.A. A white man walks into the sandwich shop, looks at the menu and orders a turkey on rye sandwich. An attendant prepares the sandwich and gives it to the white man. The white customer pays the attendant and walks out. Then, a black man comes to the same shop, orders the same sandwich but receives a very different response. The black man is told that this shop cannot serve him.
This is an example of what? If all else is equal, we clearly witnessed an example of a civil rights violation. Specifically, we are seeing Jim Crow racism in action. Why? Put simply, the white man could get something the black man could not simply because of his skin color.
Now, let us look at a modification of the previous scenario. A black man walks into a sandwich shop on Main Street, U.S.A. He walks to the counter without viewing the menu or glancing at the order board above the attendant’s head. Then, he asks for a Brontosaurus on Soylant Green sandwich. Dumfounded, the attendant replies, “Well, sir, that’s not on the menu.” He continues, “The brontosaurs went extinct millions of years ago and Solyant Green is just a mythical construct invented for a 1970s movie starring Charlton Heston.” The resigned though still hungry black man walks out, passing a white man on the way into the shop. The white man, astonishingly, asks for the same brontosaurus on Soylant Green sandwich. To this request, the attendant counters, “look, pal, I do not know what type of joke this is, but that’s just not on the menu.”
Now, this is an example of what? A civil rights violation? Racism? No. They received equal treatment. Both the white man and the black man asked for the same thing, and both were refused. The reason was simple; the request was not on the menu.
Moving closer to our targeted issue, imagine a justice of the peace’s office on Getto Street in Warsaw, Poland in 1940. A blond haired, blue eyed Methodist (a protestant Christian denomination) woman walks into the office arm in arm with the man who hopes to marry her. After explaining their intentions, the German appointed justice of the peace asks for their papers. He reviews them, abruptly stops and harshly says, “You, sir, are a Jew. A Jew will never marry an Aryan in Hitler’s Poland!” The couple withdraws in fear. A month later, the same woman returns with a Methodist male companion and requests a marriage license. The same justice of the peace reviews their papers and grants the happy couple a marriage license.
What is this? A civil rights violation has occurred. In this situation, we see religious discrimination. The Jewish fiancée was denied the right to marry his gal, but a protestant man was able to marry the woman without a problem.
Let’s return to Ghetto Street. As a way of compensating for losing his one love, the Jewish man finds three Jewish women willing to enter into a polygamous marriage with him. So, he braves the justice of the peace once more to ask for a marriage license. Without even looking at the papers of the four people before him, the justice exclaims, “You want to marry how many girls! This is, of course, entirely illegal, and I cannot do it.” Moments later, a Methodist man arrives with three blonds in tow. He says, “I can’t wait to marry these gals; let’s get the paperwork out of the way!” To this the justice responds, “This must be international polygamy day! However, the law remains; you cannot marry more than one woman, sir.”
In this scenario, we again see the difference between a civil rights violation and fair application of a rule. Neither man could marry his trio. The discriminatory religious preference of the justice of the peace did not affect his decision. The law stated that one person could have but one spouse at a time, and the justice applied the law fairly.
Connecting the two situations and four scenarios described, one can see that both highlight the difference between civil rights violations and fair applications of societal prohibitions. Civil rights violations occur when a particular group enjoys privileges fundamentally denied to others. When you strip the emotion and religious arguments away, it is fairly easy to see and understand this.
Let’s apply our newfound clarity to the homosexual marriage issue. We need to answer one fundamental question. Are homosexuals asking for a privilege given only to heterosexuals, or are they asking for something denied to both groups? In the former case, homosexuals would be the victims of a civil rights violation, but in the latter, they are simply asking for something “not on the menu.” Homosexuals are asking for the ability to marry people of the same sex. Heterosexuals have not asked for this ability, but under current laws, same sex marriage would be denied to heterosexuals as well. Neither group benefits from its sexual practices. Neither group enjoys a privilege denied to other. Therefore, homosexuals are not suffering a denial of rights. They are merely asking for a change in existing laws meant to benefit their group, a case of simple self-interest – not civil rights.
By Captain Arrrgh at 3:15 PM in Politics | Comments (8) | TrackBack (0)
بدھ 4 مارچ 2009Wednesday, March 04, 2009
All About Eve
All About Eve is a classic story, starring Bette Davis and Anne Baxter, of ambition and betrayal.
Everyone’s great in the movie and we loved it. I rate it 9/10.
By Zack at 1:35 PM in Movies | Comments (0) | TrackBack (0)
جمعہ 27 فروری 2009Friday, February 27, 2009
iPhone 3G
When the original iPhone came out in 2007, I really wanted one but I decided to wait for a while because I had my Treo 650 and had a cell service contract with AT&T as well.
I am glad I waited because I got the iPhone 3G last year and fell in love with it. It really is a revolutionary phone. Even Michelle loves it and found the touchscreen interface very intuitive. She loves to watch YouTube videos, take pictures (she has even figured out how to take screenshots), play games (Touch Hockey is her favorite), draw (Doodle Kids is the app she uses), and look at Google Maps.
There are a couple of things I do miss:
- Lack of copy and paste is the most annoying and I hope Apple adds it as soon as possible.
- Push notification support for applications and Gmail.
I have setup the iPhone to use my wireless network at home and also the AT&T wifi network at Starbucks and McDonald’s, etc. However, 3G data speeds are also very good.
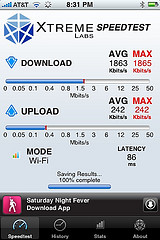


| Download (kbps) | Upload (kbps) | Latency (ms) | |
| Wifi | 1863 | 242 | 86 |
| 3G | 1201 | 249 | 169 |
| EDGE | 96 | 36 | 887 |
In accessories, I bought a Jawbone 2 bluetooth headset which reduces noise quite a lot better than any headset I have seen.
Since I use the iPhone a lot, I have to charge it every night regularly. The iPhone battery cannot be changed by the consumer, so once the battery’s gone through enough cycles, I’ll have to get Apple to install a new battery.
The applications I use the most are the following:
- Toodledo for task list
- The Weather Channel for weather forecasts and conditions
- TwitterFon for Twitter
- NetNewsWire as a feed reader for blogs etc.
- Loopt for tracking current location
- Palringo for instant messaging
- fring for Skype and other voice chats
- Google Mobile for searches etc.
- Geocaching
- Evernote for quick photo or text notes
- Jolt for quick audio notes
- “Mint.com” for bank accounts/finances
- New York Times
- BBCReader for BBC News
- Bloomberg for financial news
- Touchterm for SSH
- Stanza for e-books
- Urbanspoon for restaurants
- OpenTable for restaurant reservations
- Trailguru for trail tracks
- WordPress for updating my wordpress-based blog
- Easy Wi-Fi for logging into AT&T Wifi hotspots
- Pandora radio for streaming music
- AirMe for uploading photos to Flickr
- SimCity


I recently switched my ZackVision email accounts from being hosted by my webhost to Gmail using Google Apps. It should not change anything for those sending me emails, but I like the Gmail interface and their spam filter is also much better than the one I was using at my webhost. One problem with the email switch was transferring the tens of thousands of emails I had in my different mailboxes. Google has an Email Uploader for the purpose but it was not transferring a significant number of my emails. So I just had to set up IMAP accounts in Mozilla Thunderbird for my old and new (gmail) accounts and move the emails folder by folder. This took some time.
In addition to email, Google Apps also provides me with my own calendar and documents. So I uploaded all my Outlook contacts to Gmail and decided to switch completely away from Outlook. Instead of syncing my contacts and calendar between Outlook and iPhone via iTunes, now I am using “Google Mobile Sync”http://www.google.com/mobile/apple/sync.html to sync over the air between my iPhone and my Google calendars and contacts at my own domain. So the only real thing I need the iTunes sync for is podcast subscriptions.
And now I am salivating over the Kindle 2.
By Zack at 1:27 PM in Life , Science and Technology | Comments (3) | TrackBack (0)
ہفتہ 21 فروری 2009Saturday, February 21, 2009
Quantum of Solace
Quantum of Solace is the latest James Bond movie and I am a 007 fan. So, of course, we watched it as soon as it came out.
This new Daniel Craig Bond is different. He isn’t as suave and smooth as the earlier versions. In fact, he falls in love, goes for revenge and gets hurt. So what exactly is Bond-like about him? May be not much but I still like the new version. After so many Bond movies in the old style, it is fun to watch a Bond with cuts and bruises and hurt feelings.
I rate the movie 7/10.
By Zack at 9:50 PM in Movies | Comments (2) | TrackBack (0)
پیر 16 فروری 2009Monday, February 16, 2009
Khudkushistan
Khudkushistan, Land of Suicide Bombings, formerly known as Pakistan, Land of the Pure, is where our parents live. Thus we have to visit once in a while despite these statistics from September 2008.
Suicide attacks have killed almost 1,200 Pakistanis since July last year, most of them civilians, according to military statistics released Monday that highlight the ferocity of the militant threat facing the country.
Meanwhile, heavy fighting between Pakistani troops and insurgents on the Afghan border has sent some 20,000 Pakistanis fleeing into Afghanistan, the United Nations reported.
Figures released at a military briefing in Islamabad showed 88 suicide attacks have taken place across Pakistan since the Red Mosque siege, killing 1,188 people.
Of that figure, 847 were civilians, while the rest were troops and police. More than 3,000 were listed as injured.
So we bought tickets in mid-August for a trip in October. A week later, more than 70 people were killed in twin suicide bombings in Wah Cantt, the city where my in-laws live and thus was one of our destinations.
And just two weeks before our visit, there was a suicide bombing in our other destination, Islamabad, when Marriott Hotel was destroyed and more than 40 people killed.
So we were a bit apprehensive about our visit. I mentioned this to a few people who live in Pakistan. They seemed nonchalant and argued that they lived there and the risk was in any case minimal. I agreed that the risk was low but while they lived there, I did not and thus I was worried about visiting a war zone.
On October 3, we flew to Islamabad via Kuwait. At the Atlanta airport, it was difficult to get the ticket agent to understand that Kuwait was a city and a country and was not Iraq. She kept saying Iraq and I got so angry that Amber had to intervene. Our flight was uneventful except that Kuwait Airways food sucked and no one cares about No Smoking signs at Kuwait Airport. Also, Michelle grabbed my usual window seat and had a lot of fun watching the plane take off, fly and land.
When we reached Islamabad, we realized that my bag was lost. So we had to wait until all baggage had arrived at baggage claim and then file a missing baggage complaint. So the first order of business was to buy a toothbrush and some clothes for me. Fortunately, we got the bag the next day.
While we were in Islamabad, there was a suicide bombing at the Islamabad Police HQ, which just goes to show how appropriate the name I have coined, Khudkushistan, is.
There was a lot of road construction going on in Islamabad and Wah area. Some roads have also been widened since the last time we were there. Also, this was the first time I drove on the limited-access toll highway. After I saw the condition of the GT Road, I decided to use the M-1 motorway(Pakistan) to drive between Islamabad and Wah Cantt. Interestingly, most of the vehicles on the motorway drove nowhere near the 120km/hr (75mph) speed limit and I had a lot of fun.
One new thing on the roads of Islamabad and Wah Cantt were the blockades by the police. There are usually two or three fences or other barriers right after each other so that the vehicles have to slow down completely and zig zag through them. Some of these blockades were quite dangerous with sharp metal pointing towards you probably to dissuade anyone from running through the blockade.
We also noticed that signs of any military related buildings that used to there were nowhere to be seen now. For example, the Pakistan Military Academy near Abbottabad has no signs on the main road pointing to its location. Similarly, the Naval Sailing Club at Rawal Lake in Islamabad is difficult to find without any signs.
Unlike our last visit, I didn’t have huge allergy issues and stayed mostly healthy during our trip. Michelle had a lot of fun with her grandparents, aunt, uncle and cousins.
Here are some random photographs from our trip.


On our way back, it took me a long time to go through immigration in New York City and we barely made the flight to Atlanta. Thus we waited at baggage claim at the Atlanta airport for a long time without any bags. All our bags were delivered to our home the next day.
By Zack at 11:41 PM in Pakistan , Travel | Comments (6) | TrackBack (0)
جمعرات 12 فروری 2009Thursday, February 12, 2009
Darwin Day
Today is Darwin Day, the 200th birthday of Charles Darwin, the man who revolutionized biology. 2009 is also the 150th anniversary of the publication of his seminal work, On the Origin of Species. Thus there are events planned all through the year. Some fun reading is:
I have not actually read On the Origin of Species yet, but I plan to before November 24, which is its original publication date (in 1859).
Of course, everyone has heard of Darwin and his theory of natural selection. But it was only while doing some literature search for my graduate work that I actually read one of Darwin’s works. That is his book The Expression of the Emotions in Man and Animals. I found it a fascinating read and my estimation of Darwin as a great scientist grew as a result.
You can read the book on Google Books or Project Gutenberg and see the images included on Wikimedia Commons.
By Zack at 12:59 PM in Science and Technology | Comments (0) | TrackBack (0)
پیر 2 فروری 2009Monday, February 02, 2009
Dreams from My Father
I usually do not read autobiographies. Or books by politicians. But Dreams from My Father: A Story of Race and Inheritance is an exception.
First of all, it’s written by Barack Obama and was written before he got into politics. So it’s refreshingly honest. Secondly, Obama writes well, very well.
Dreams from My Father is basically about the young Obama’s quest for identity. As a child of a Kenyan black man and a Kansan white woman who was raised by his mother and maternal grandparents, he was somewhat of an outsider to both the African American experience and the general White majority.
It is a work of self-reflection and Obama comes across as a thoughtful and honest person.
I read the book on the way to Pakistan (more about that in my next blog post) and during my stay there.
If you want to understand Obama the man and where he comes from, I think this book is essential reading.
By Zack at 3:55 PM in Books , Politics | Comments (0) | TrackBack (0)
منگل 13 جنوری 2009Tuesday, January 13, 2009
Free At Last
This is the story of one fine cold day a long time ago in a galaxy far, far away.
I woke up early and left home at 7:30am as I had to drive through rush hour traffic. It took me an hour to get to 2150 Parklake Dr. I went in, got through the metal detector and bag screening and took the elevator to the 2nd floor. The first thing I did there was to look for the restrooms. Then I waited.
My appointment was at 9:05am, but the interviewer came to get me at 9:35. I went to her office where I had to take an oath to tell the truth. She asked me for my driver’s license, passport and green card. Then she went over my application, asking about any changes. She also asked me if I had ever been a member of the Communist party or a terrorist organization, if I had ever been arrested, convicted, committed a crime or lied to the government. Then it was time for the test. She got the computer to print out 10 random questions about US civics, history and government. Those were real easy, but even easier were the one simple sentence she asked me to write and another that she asked me to read. She gave me a form telling me that I had passed the tests of English and US history and government and that my application has been recommended for approval. Then she asked if I wanted to be part of the oath ceremony the same day. Of course, I did. And so I was done in about 15 minutes.
I then sat in the waiting room for the oath letter for 45 minutes. When I got the letter, I realized I had time to kill as it was only 10:45 and the oath was at 2pm. I called Amber and we decided to go for lunch at Tamarind Seed Thai Bistro in Midtown. I had Spicy Lamb with Basil, which was spicy but was also very very tasty.
After lunch, I got back to the USCIS office and went to the room where the oath ceremony takes place. First, we had to check our naturalization certificates for any mistakes. Then we were all seated. Every seat had a packet which contained:
- A US flag
- A page with the oath of allegiance and the pledge of allegiance to the flag
- A list of things new citizens need to do
- A letter of congratulations from the President
- A pocket booklet including the Declaration of Independence and the US Constitution and its amendments
- The Citizen’s Almanac
When all the prospective citizens were seated, their relatives who had come to witness the ceremony were called in.
The Field Office Director then talked a bit and told us that there were 110 people becoming citizens and they came from 44 countries. Then she called everyone to stand going by their country of origin. I couldn’t note down the list of countries represented there, but there were Afghanistan, Guyana, Iran, Ireland, Pakistan, Mexico, India, South Africa, Kampuchea, Ireland, Yugoslavia and others. Then all of us held up our right hands and repeated after the Director the oath of allegiance.
I hereby declare, on oath, that I absolutely and entirely renounce and abjure all allegiance and fidelity to any foreign prince, potentate, state, or sovereignty of whom or which I have heretofore been a subject or citizen; that I will support and defend the Constitution and laws of the United States of America against all enemies, foreign and domestic; that I will bear true faith and allegiance to the same; that I will bear arms on behalf of the United States when required by the law; that I will perform noncombatant service in the Armed Forces of the United States when required by the law; that I will perform work of national importance under civilian direction when required by the law; and that I take this obligation freely without any mental reservation or purpose of evasion; so help me God.
While we were taking the oath, the relatives who had come along were taking pictures.
And suddenly, we were all citizens of the United States. Then we recited the pledge of allegiance, which I have always liked without the words under God.
I pledge allegiance to the flag of the United States of America, and to the Republic for which it stands: one Nation under God, indivisible, With Liberty and Justice for all.
Then the Director reminded us of what we needed to do: Change status with the Social Security Administration, apply for a passport and register to vote.
Finally we saw a video welcome by President George W. Bush. On our way out, we took our naturalization certificates. The employees at the front desk and the security personnel congratulated us as we were leaving the building. I have never seen anyone at INS or USCIS act so courteous before.
Let’s get back to the title of this article: Free At Last! No, that doesn’t refer to the freedoms guaranteed by the US constitution. Instead, it celebrates my freedom from the United States Citizenship and Immigration Services (USCIS). I have never seen a worse bureaucracy.
By Zack at 12:42 AM in Immigration , Life | Comments (17) | TrackBack (0)
جمعرات 8 جنوری 2009Thursday, January 08, 2009
Into the Wild
It feels a bit strange to watch a movie with an ending that you know about. Yes, there are movies about history and about celebrities, but this isn’t one of them. Into the Wild is a movie about a young man who leaves home after college and wanders around the country, finally deciding to go to the Alaska wilderness.
It’s an oddly compelling movie which I watched like a sociopath waiting for him to die. Of course, Amber cried a lot.
The one thing I wasn’t able to really understand was why he left home and life as a middle class person. It was clear that his relationship with his parents wasn’t good, but explaining that was the movie’s weakest point.
I rate the movie 8/10.
By Zack at 5:33 PM in Movies | Comments (2) | TrackBack (0)
جمعرات 18 دسمبر 2008Thursday, December 18, 2008
Georgia Senate Runoff Analysis
This is the last in my series analyzing the 2008 election in the state of Georgia. I looked at statewide numbers in my first article. The next article looked at county level results and also racial polarization. In the 3rd article, I analyzed the results in Fulton county and specifically the precincts in which our team of Obama volunteers worked.
Georgia has a law according to which a winning candidate needs 50% + 1 of the votes cast, otherwise there is a runoff election between the top two candidates. In the general election on November 4, incumbent Republican Senator Saxby Chambliss failed to get 50% and thus was forced into a runoff with the Democratic candidate Jim Martin. Interestingly, this was the second runoff for Jim Martin this year since he had won in a runoff election in the Democratic primary too after no one got 50% in the crowded filed of Democratic Senate candidates in the primary election.
I did not work for the Jim Martin campaign and in fact was fairly certain that he would lose the runoff because Georgia is still a Republican state and there are a lot more habitual Republican voters here than Democratic ones. The Obama campaign had done a good job of registering voters and then bringing the sporadic voters out to vote for the general election, but there was no way that could be repeated for a runoff. Also, from our voter contact when we were volunteering for the Obama campaign, we knew that Sarah Palin was quite popular among Republicans here, perhaps more than John McCain (McCain got 31.6% of the vote and came in 2nd behind Huckabee and barely ahead of Romney in the Feb 5 primary.)
| Chambliss | Martin | Total | |||
|---|---|---|---|---|---|
| Votes | % | Votes | % | Votes | |
| General | 1,867,090 | 49.75% | 1,757,419 | 46.83% | 3,752,577 |
| Runoff | 1,226,730 | 57.46% | 908,222 | 42.54% | 2,134,952 |
As you can see, a lot less people voted in the runoff than in the general election. Let’s look at the voter retention rate, i.e. the number of votes for a candidate in the runoff as a proportion of the votes in the general election.
| Chambliss | Martin | Total | |
|---|---|---|---|
| Vote Retention | 65.7% | 51.7% | 56.9% |
While only about 57% of the voters in the general voted in the runoff, they were not evenly distributed between the parties. Democrat Jim Martin barely managed to get half of his voters to pull the lever for him again while Republican Saxby Chambliss was successful with almost two-thirds of his voters. This is why the Republican margin increased from 2.92% on November 4 to 14.92% on December 2.
Let’s plot the percentage of votes the two candidates got in each county in the general and the runoff elections. The circles represent individual counties and their area is proportional to the number of registered voters in that county.


Chambliss performed better in all counties and Martin performed worse in almost all in the runoff when compared with the general election.
Another way to look at the data is to compare the vote retention rates for Chambliss and Martin.
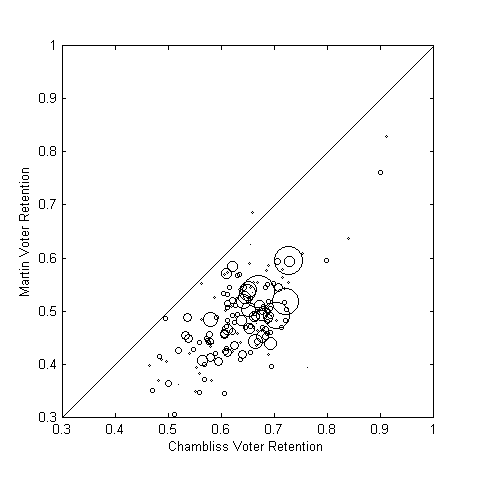
Chambliss got about 60-70% of his general election vote in most counties, especially the more populous counties while Martin only got 45-60% in most. The only counties close to parity in terms of vote retention were really small.
I was wondering whether there was any pattern to the vote retention in terms of partisanship. So I plotted the Chambliss and Martin retention rates against the percentage in that county that voted for Obama on November 4.

This is a slight upward trend as the counties get more Democratic. However it is still very low.

We see much less of a pattern here.
By Zack at 12:24 AM in Politics | Comments (0) | TrackBack (0)
اتوار 14 دسمبر 2008Sunday, December 14, 2008
Georgia Election Analysis III
I did some analysis of the Presidential election in the state of Georgia in two installments. Today I’ll look at Fulton county where I live as well as the specific precincts in Alpharetta, Milton and South Atlanta where our team worked as volunteers for the Obama campaign.
| Year | D | R | Turnout | %Turnout |
|---|---|---|---|---|
| 2000 | 57.53% | 39.68% | 264,276 | 65.06% |
| 2004 | 59.35% | 39.99% | 330,791 | 74.15% |
| 2008 | 67.07% | 32.09% | 405,531 | 73.11% |
There was a 15.3% swing towards Obama in Fulton county compared to Kerry in 2004. The turnout, based on the number of registered voters, stayed constant from 2004 to 2008. However, if we use the voting age population estimates (VAP) for Fulton county, we get the following turnout rates:
| Year | Turnout based on VAP |
|---|---|
| 2000 | 42.30% |
| 2004 | 48.00% |
| 2008 | 52.72% |
This shows a bigger turnout in 2008. One reason for the discrepancy between the turnout in the first table and this one is that the Obama campaign focused a lot on voter registration this year and thus got more people registered.
Also, please note that the VAP turnout estimate is probably lower than the real turnout which should be calculated as a proportion of the voting eligible population.
Out of the 3,924,440 votes cast for President in Georgia this year, 2,084,179 (or 53.11%) were cast during advance/early voting or by absentee mail-in. In Fulton county, 184,240 votes (45.42%) were cast early, absentee or provisional out of a total of 405,628 votes cast. This is very unusual for Georgia and Fulton as can be seen in the table below for Fulton county. (This shows the numbers for the 2004 general election for President, the 2006 election for Governor, the 2008 Presidential Primary on Super Tuesday and the 2008 general Presidential election.)
| Year | Absentee/Early/Provisional votes |
|---|---|
| 2004 Prez | 12.68% |
| 2006 Gov | 11.76% |
| 2008 Prez Primary | 7.65% |
| 2008 Prez | 45.42% |
In the 2008 general election, the Obama campaign tried to get everyone to vote early. The effect of this can be seen in the early voting numbers in Fulton county where Obama had a 49.5% lead in early voting compared to a 22.9% lead on polling day itself.
The large numbers of early voters have complicated my precinct level analysis. The precinct level data does not include early or absentee votes which are listed separately as one per county. Still let’s see what we can conclude for our precincts.
For the Get Out the Vote (GOTV) campaign in October and then the first four days of November, we were based in the South Atlanta precincts, 12E1, 12J and 12T, which are just north of Atlanta’s Hartsfield-Jackson Airport. These precincts are heavily Democratic (more than 90%) but there are a lot of sporadic voters there. So the main task was to get the vote out.
| Election | 12E1 | 12J | 12T | |||
|---|---|---|---|---|---|---|
| Voted | %Turnout | Voted | %Turnout | Voted | %Turnout | |
| 2004 | 518 | 49.5% | 1024 | 59.7% | 566 | 62.3% |
| 2006 | 224 | 22.1% | 473 | 29.2% | 581 | 35.8% |
| 2008 Primary | 280 | 27.5% | 564 | 34.6% | 609 | 39.1% |
| 2008 | 747 | 55.1% | 1,360 | 67.3% | 1,232 | 68.0% |
Thus, turnout as a percentage of registered voters increased from 57.4% to 64.3% while actual number of people who voted in these three precincts increased from 2,108 to 3,339, a 58% increase in the number of voters. Compare this 58% increase to a 22.6% increase over the whole of Fulton county and a 19.6% increase over all of Georgia. I am actually pleased at these numbers and I am sure all of our Obama team would be too.
Let’s now look at the precincts in Alpharetta and Milton where we made the most calls, starting in August, for identifying voters, persuading them and then getting them out to vote. The table below shows the Republican advantage over Democrats. For the 2008 Presidential Primary, I added the votes for all the Republican Presidential candidates together and did the same for the Democrats. Let’s take the example of ML01A in the 2008 general election, McCain got 73.5% and Obama got 25.3%, which means a Republican advantage of 73.5-25.3=48.2%.
| Precinct | 2006 | 2008 Primary | 2008 |
|---|---|---|---|
| AP07B | +66.0% | +33.2% | +40.9% |
| ML01A | +64.0% | +34.4% | +48.2% |
| ML02A | +67.4% | +40.8% | +62.6% |
| ML02B | +68.0% | +45.2% | +57.5% |
| ML03 | +66.9% | +45.7% | +59.5% |
| ML04 | +65.2% | +38.5% | +56.5% |
| ML05 | +48.9% | +14.9% | +37.7% |
| ML06 | +29.9% | -11.4% | +8.2% |
| ML07 | +65.1% | +41.8% | +52.0% |
I couldn’t find the data for the 2004 Presidential election for the Milton (MLxx) precincts but AP07B had a 42.9% Republican advantage in 2004.
Before I opine on those results, let’s look at the turnout (as a percentage of registered voters) in these precincts:
| Precinct | 2008 Turnout |
|---|---|
| AP07B | 44.6% |
| ML01A | 44.6% |
| ML02A | 55.3% |
| ML02B | 55.3% |
| ML03 | 52.5% |
| ML04 | 44.7% |
| ML05 | 44.2% |
| ML06 | 41.9% |
| ML07 | 54.2% |
We already know that about half of Georgia and Fulton county voters voted early. The early voters are not listed in the last two tables for the Alpharetta/Milton precincts because they are not reported that way by Fulton county. Looking at the election day turnout for Milton, it seems that fewer than half of the voters voted early.
Because we only have the vote breakdown by party for those who voted in person at their polling location on November 4 and a significant number of voters had voted early in 2008, we cannot really say what the margin between McCain and Obama was in Alpharetta and Milton. There is no reason to believe that the early voters had the same partisan distribution as those on election day. In fact, there is reason to believe that the early voters were more likely to be Obama supporters. The Obama campaign had been working hard asking people to vote early. Also, in the whole of Fulton county, Obama had a 49.5% advantage in early voting compared to a 22.9% advantage on polling day. Thus, the very large Republican margin in the Milton precincts in 2008 is most likely not correct. I can say with certainty that McCain won all those precincts except ML06 but probably with a somewhat smaller margin. Even then, Republicans had a huge advantage here in North Fulton. Unfortunately, we don’t have any way of finding out whether our team was able to reduce that Republican advantage or not.
Next: A look at the Senate runoff between Jim Martin and Saxby Chambliss.
By Zack at 1:33 PM in Politics | Comments (6) | TrackBack (1)
منگل 9 دسمبر 2008Tuesday, December 09, 2008
Georgia Election Analysis II
Continuing with my election analysis in Georgia, my data source is the Secretary of State’s website:
- 2004 County level results
- 2004 county registration and turnout statistics by race and gender
- 2008 county level results
- 2008 county voter registration statistics by race and gender
Let’s start with a graph showing Obama’s share of the vote in each Georgia county versus Kerry’s share four years ago. Please note that the size of the circles is proportional to the total number of registered voters in that county.

Since there was an 11.4% swing towards Obama compared to Kerry, a majority of the counties show a larger percentage for Obama as compared to Kerry. This is especially true of large (in population) counties. Since Georgia has 159 counties, let’s redo the same graph separately for the large, middle and small counties.
In the largest 53 counties (min number of registered voters 17,354 and max 554,682), only the most Republican counties got more Republican compared to 2004.

In the middle 53 counties (registered voters ranging from 8,182 to 17,018), the situation was a lot more mixed, but Obama did lose a lot of ground in some.

In the 53 counties with the lowest populations (registered voters ranging from 1,371 to 7,988), Obama did better in some and worse in others. However, these rural counties don’t have many people and probably didn’t matter much at all for the Presidential election.

Since one major reason for Obama’s better performance was the higher turnout and vote from African Americans, let’s look at the same data, i.e. Obama’s total vote share compared to Kerry’s, but by categorizing counties by how white they are. I am using the percentage of registered white voters in a county as a proxy for the percent population that’s non-Hispanic White in a county.
The whitest third of the counties are at least 77% white. Do note that the scales of this graph are different from the earlier graphs. Obama did worse in the smaller, whiter counties than Kerry and better in the bigger white counties. But he didn’t get more than about 35% of the vote in any of them.

The middle third counties by white percentage of the population have about 64% to 77% whites. Obama generally did better than Kerry here. Obama’s share of the vote varied from 27-45% in these counties except for Clarke county (65%) which contains Athens and the University of Georgia.

In the bottom third counties, the white percentage is 18-64% and Obama did very well here.

Let’s look at Obama’s share of the vote in each county plotted against the percentage of whites and blacks in that county.

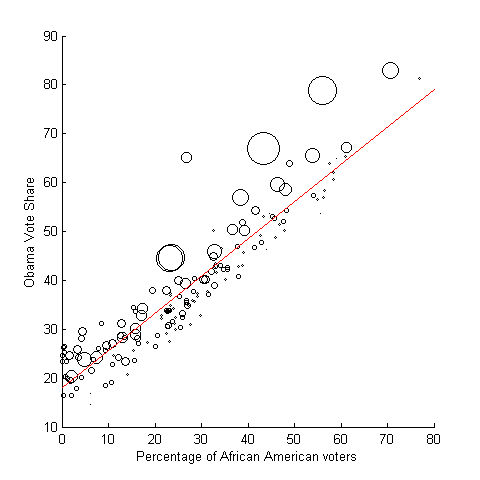
The red line in both graphs is the least squares fit. As is obvious, Obama’s share of the vote decreases as the percentage of whites increases in a county.
In the previous two graphs, we looked at Obama’s share of the total vote. So we cannot completely tease out the effects of a large African American turnout or the how the white voters voted in each county. Since we can’t have the numbers for Obama’s share of the white vote in each county, we’ll make some simplifying assumptions to guesstimate it:
- The African American turnout in each county was the same as the total voter turnout in that county. This is approximately true at the state level, but could be wrong for some counties.
- 98% of the African American voters voted for Obama. This is the percentage at the state level.
- The number of voters who are not African American or White is small enough (5%) that we can approximate the white vote share by simply excluding the African American vote.
We know this procedure gives us only a guesstimate of the nonblack vote since in one small county (Clay) this results in Obama getting -1.85% of the nonblack vote. In the other 158 counties, Obama’s share of the nonblack vote varies from 4.4% (Randolph county) to 54.6% (Dekalb county).

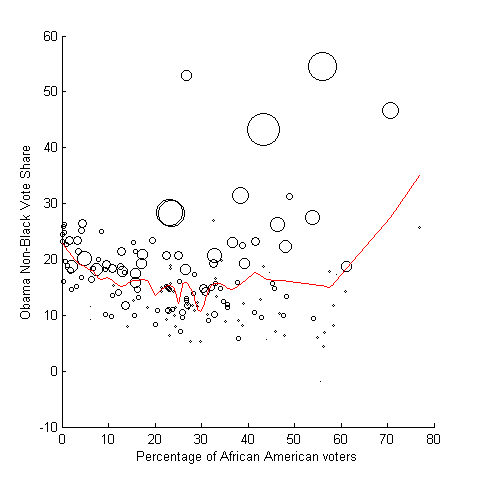
The red lines in both graphs are LOESS fits.
The first thing apparent in these two graphs is that Obama did particularly well among whites in most of the populous counties as they show up outliers at the top. Among the other counties, there is not a significant pattern, but it does look like Obama’s nonblack vote share is lowest in counties where African American population is in the 20-30% range.
Razib did a similar analysis of racial polarization in Mississippi.
Charles Franklin analyzed the white vote for Obama at the state level. Nate Silver saw that data and noticed that most of the states where Obama performed worse than Kerry among whites were those where Obama did not campaign.
Andrew Gellman, at his must-read blog Red State Blue State Rich State Poor State, looked at Obama’s vote share divided by race in the West, Northeast, South and Midwest. He also showed the estimated nonblack vote by county for all of the US.
Andrew Gellman also looked at the voting preferences of rich and poor voters in both red and blue states in the 2008 election, something which is the topic of his book Red State, Blue State, Rich State, Poor State: Why Americans Vote the Way They Do.
Finally, Michael McDonald estimates the voter turnout from the vote eligible population.
My revised national turnout rate for those eligible to vote is 61.6% or 131.3 million ballots cast for president. This number does not include an approximate 1.4 million under and over votes, for an estimated total 132.7 million total ballots cast. This represents an increase of 1.5 percentage points over the 60.1% turnout rate of 2004, but falls short of the 1968 turnout rate of 62.5%.
His estimate of turnout for Georgia is 61.1%, up from 56.2% in 2004.
Next: An analysis of the precincts in Alpharetta, Milton and Atlanta where our team worked.
By Zack at 2:21 PM in Politics | Comments (2) | TrackBack (2)
جمعہ 14 نومبر 2008Friday, November 14, 2008
Georgia Election Analysis I
This is the first in a series of posts looking at the Presidential election results in the state of Georgia.
Let’s start with the top line numbers from the last three Presidential elections:
| Year | Democrat | Republican | ||
|---|---|---|---|---|
| Votes | Percentage | Votes | Percentage | |
| 2000 | 1,116,230 | 43.2% | 1,419,720 | 55.0% |
| 2004 | 1,366,155 | 41.4% | 1,914,256 | 58.0% |
| 2008 | 1,844,137 | 46.9% | 2,048,744 | 52.1% |
In 2000, Al Gore lost Georgia by 11.8 points and Kerry lost by 16.6 points. Obama has reduced that to 5.2 points, which is a swing of 11.4 percent from 2004. This swing is greater than the national swing of 9.2%.
Let’s look at the Georgia exit polls from 2000, 2004 and 2008.
During the last 8 years, the composition of the voters has changed a lot. The table below shows the percentage of voters who belonged to a specific race or ethnic group.
| Race | 2000 | 2004 | 2008 |
|---|---|---|---|
| White | 81% | 70% | 65% |
| African American | 19% | 25% | 30% |
| Hispanic | - | 4% | 3% |
That’s quite a change in voter demographics, Compare that to the census estimate of population (in 2006) of 58.9% non-Hispanic whites, 29.9% African Americans and 7.5% Hispanics. This shows that African Americans, probably for the first time in Georgia history, voted in proportion of their population. The credit for that goes to the Obama campaign’s voter registration and Get-Out-the-Vote (GOTV) efforts.
Turnout this year was a little lower than 2004, mostly because of the high turnout among whites in 2004.
| 2000 | 2004 | 2008 | |
|---|---|---|---|
| Total | 69% | 77% | 76% |
| White | 71% | 80% | 78% |
| African American | 63% | 72% | 75% |
Since I am estimating White and African American turnout in 2008 from the exit polls, it might be prone to some error. We’ll know more when all the detailed data is released by the Georgia Secretary of State.
If African American turnout could be higher, Obama might have gotten closer by at most 1 point. However, do remember that in absolute numbers 41% more African Americans voted this year compared to 2004. The increase in the number of white voters was less than 9%.
The next table shows why Obama lost. It tells us what portion of whites and blacks voted for the Democratic Presidential candidate in the last three elections.
| Race | 2000 | 2004 | 2008 |
|---|---|---|---|
| White | 35% | 23% | 23% |
| African American | 86% | 88% | 98% |
Obama needed around 27% or more of the white vote. However, he got the same proportion as Kerry.
Looking at voter groups, 37% of all voters (i.e. 57% of white voters) were white evangelicals. Obama got only 10% among them. Since he got 23% among all whites, so Obama got 40% of the white non-evangelical vote. Compare to Kerry who got 16% of white evangelical vote and 30% of white non-evangelical vote. Also, compare nationally where Obama got 43% of the white vote and 24% of white evangelical voters, i.e. Obama got a majority (53%) of non-evangelical white vote nationally.
Young voters nationally flocked to Obama in this election, a lot more than in recent elections. This can be seen in the graphs here.
| 18-29 | 30-44 | |||
| US | GA | US | GA | |
| All | 66% | 48% | 52% | 56% |
| White | 54% | 20% | 41% | 32% |
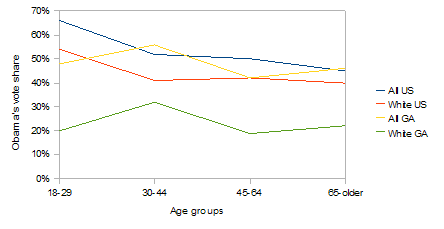
The low number (20%) for 18-29 year old white voters in Georgia surprised me a lot. It shows how difficult it might be for Democrats to win Georgia even in the future.
Nationally, Obama did somewhat better with white voters than Kerry in 2004. However, there were regional variations. In Appalachia and parts of the South, Obama got a smaller percentage of the white vote than Kerry did.
Southern counties that voted more heavily Republican this year than in 2004 tended to be poorer, less educated and whiter, a statistical analysis by The New York Times shows. Mr. Obama won in only 44 counties in the Appalachian belt, a stretch of 410 counties that runs from New York to Mississippi. Many of those counties, rural and isolated, have been less exposed to the diversity, educational achievement and economic progress experienced by more prosperous areas.
The increased turnout in the South’s so-called Black Belt, or old plantation-country counties, was visible in the results, but it generally could not make up for the solid white support for Mr. McCain. Alabama, for example, experienced a heavy black turnout and voted slightly more Democratic than in 2004, but the state over all gave 60 percent of its vote to Mr. McCain. (Arkansas, however, doubled the margin of victory it gave to the Republican over 2004.)
Less than a third of Southern whites voted for Mr. Obama, compared with 43 percent of whites nationally.
Do look at this table and a map of the US showing county-level electoral shifts.
MSNBC First Read gives the details of Obama vote share among whites.
In 13 [states], Obama received less than 35% of the white vote. His three lowest performing states: Alabama (10%), Mississippi (11%), and Louisiana (14%). The other 10: GA (23%), SC (26%), TX (26%), OK (29%), AR (30%), UT (31%), AK (32%), WY (32%), ID (33%), and TN (34%). On the other hand, Obama won the white vote in 18 states and DC: CA, CO, CT, DE, DC, HI, IL, IA, ME, MA, MI, MN. NH. NY. OR, RI, WA, WI and VT. Obama’s lowest percentage of the white vote he received in a state that he won: NC (35%). The highest percentage of the white vote Obama received in a state he lost: MT (45%).
Razib has a few maps showing Obama’s performance among white voters in all the states compared to Kerry’s performance in 2004 as well as to the national average for white voters this year.
Pollster shows that in states with higher than about 20-25% of African American population, Obama performed poorly among white voters.
If you are interested in comparing Democratic or Republican performance over the years in Presidential elections in Georgia, Dave Leip’s Atlas of US Presidential elections has the historical results in a convenient table format.
All things considered, Barack Obama did very well in Georgia. I was always skeptical about the Democrats winning Georgia, except in a national landslide. How well did the Obama campaign bigwigs think they could do in Georgia can be gauged from this anecdote from August 27.
[Obama’s election manager David Plouffe] said that the campaign’s target in Georgia is about 47% of the vote, owing to Ex-Rep. Bob Barr’s ability to siphon votes away from John McCain.
In the end, Bob Barr didn’t do well at all, but Obama got his 47% of the vote. It looks to me like the Obama campaign knew what it was doing. Do you remember the Obama spreadsheet that leaked just after Super Tuesday and was remarkably accurate about the primary results?
There’s a lot more I want to analyze, including county and precinct level data, precincts in which our team worked. So tune in for more analysis and rambling soon.
By Zack at 11:35 AM in Politics | Comments (4) | TrackBack (3)
 Posts with this logo are written in the
  Posts with this logo use
 ")


")
![Pan's Labyrinth [Blu-ray]](https://swap.stanford.edu/was/20100322163935im_/http://ecx.images-amazon.com/images/I/51OVBkk38sL._SL160_.jpg "Pan's Labyrinth [Blu-ray]")
")
![Taken [Blu-ray]](https://swap.stanford.edu/was/20100322163935im_/http://ecx.images-amazon.com/images/I/41HameCDvlL._SL160_.jpg "Taken [Blu-ray]")
![The Curious Case of Benjamin Button [Theatrical Release]](https://swap.stanford.edu/was/20100322163935im_/http://ecx.images-amazon.com/images/I/51lR-IXa8wL._SL160_.jpg "The Curious Case of Benjamin Button [Theatrical Release]")


