Jump to main content or area navigation.

Contact Us

Air Trends

Nitrogen Dioxide

National Trends in Nitrogen Dioxide Levels
Regional Trends in Nitrogen Dioxide Levels
Local Trends in Nitrogen Dioxide Levels

National Trends in Nitrogen Dioxide Levels

Using a nationwide network of monitoring sites, EPA has developed ambient air quality trends for nitrogen dioxide (NO2). Under the Clean Air Act, EPA sets and reviews national air quality standards for NO2. Air quality monitors measure concentrations of NO2 throughout the country. EPA, state, tribal and local agencies use that data to ensure that NO2 in the air is at levels that protect public health and the environment. Nationally, average NO2 concentrations have decreased substantially over the years. For information on NO2 standards, sources, health effects, and programs to reduce NO2, please see www.epa.gov/airquality/nitrogenoxides/.

Nitrogen dioxide air quality between 1980 and 2014, based on the annual 98th percentile of daily maximum 1-hour averages.  Chart shows a range of concentrations in 29 monitoring sites nationwide, with the average decreasing 60% from 1980 to 2014.  Most of the sites have had concentrations below the national standard since the early 1980s.

How to Interpret the Graphs
View the chart data in Microsoft Excel  (Download Excel Viewer) Exit EPA Disclaimer
View the chart data in HTML  (New window opens)


Nitrogen dioxide air quality between 1990 and 2014, based on the annual 98th percentile of daily maximum 1-hour averages.  Chart shows a range of concentrations in 98 monitoring sites nationwide, with the average decreasing 46% from 1990 to 2014.

How to Interpret the Graphs
View the chart data in Microsoft Excel  (Download Excel Viewer) Exit EPA Disclaimer
View the chart data in HTML  (New window opens)


Nitrogen dioxide air quality between 2000 and 2014, based on the annual 98th percentile of daily maximum 1-hour averages.  Chart shows a range of concentrations in 180 monitoring sites nationwide, with the average decreasing 29% from 2000 to 2014.

How to Interpret the Graphs
View the chart data in Microsoft Excel  (Download Excel Viewer) Exit EPA Disclaimer
View the chart data in HTML  (New window opens)


Regional Trends in Nitrogen Dioxide Levels

Air quality trends can vary regionally. The following climatically consistent regions within the contiguous United States provide a relevant way to look at regional trends in air quality.
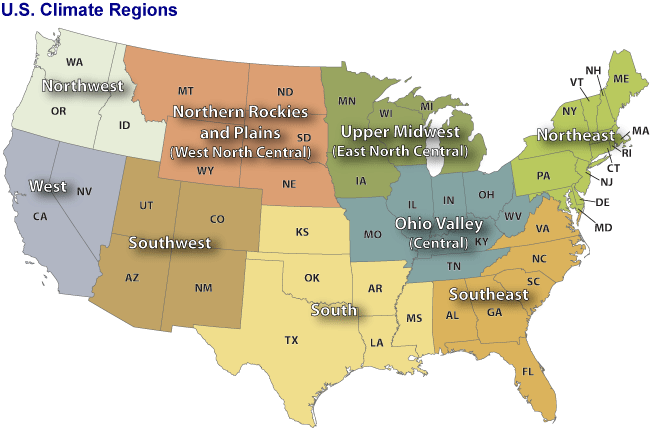

Note: The Upper Midwest and Northwest regions do not have enough data to construct a regional trend.

Source: NOAA National Climatic Data Center

Local Trends in Nitrogen Dioxide LevelsNote to users of screen readers:  The Local Trends information is available on the web only as graphical images.  Please call 919-541-5224 for assistance.

Air quality trends can vary from one area to another. Local trends can be viewed at individual monitoring locations in the map below or in this KML file (KML, 303 KB) using Google Earth or another KML browser. 

 Nitrogen dioxide monitors that meet mimimum trends completeness criteria
 Nitrogen dioxide monitors that have some data during the trend period but do not meet the mimimum trends completeness criteria

Related Links | Acronyms | Hardcopies

Jump to main content.