You are here:
About the Risk-Screening Environmental Indicators (RSEI) Model
On this page:
- Highlight potential problems and set priorities
- Quickly analyze and compare large amounts of data
- Questions RSEI can answer
Highlight potential problems and set priorities
Risk-Screening Environmental Indicators (RSEI) is a geographically-based model that helps policy makers and communities quickly analyze large amounts of data on releases of toxic substances from facilities in an area. RSEI can help identify situations that may pose risks to human health and, therefore, require further evaluation. It is often used to help officials set priorities for action. ![]() toxicity weightThis weight is a proportional numerical weight applied to a chemical based on its toxicity. The toxicity of a chemical is assessed using EPA-established standard methodologies. For each exposure route, chemicals are weighted based on their single, most sensitive adverse chronic human health effect (cancer or the most sensitive noncancer effect). In the absence of data, the toxicity weight for one pathway is adopted for the other pathway. The range of toxicity weights is approximately 0.02 to 1,400,000,000.
toxicity weightThis weight is a proportional numerical weight applied to a chemical based on its toxicity. The toxicity of a chemical is assessed using EPA-established standard methodologies. For each exposure route, chemicals are weighted based on their single, most sensitive adverse chronic human health effect (cancer or the most sensitive noncancer effect). In the absence of data, the toxicity weight for one pathway is adopted for the other pathway. The range of toxicity weights is approximately 0.02 to 1,400,000,000.
RSEI uses information from EPA’s Toxics Release Inventory (TRI), which tracks toxic chemical releases and waste management activities at industrial and federal facilities across the United States. Visit the Toxics Release Inventory website.
By analyzing TRI information together with risk factors, such as the amount of chemical releases, each chemical’s toxicity, and size of the exposed population, RSEI calculates a numeric score, which can be compared to other scores calculated by RSEI. RSEI uses simplifying assumptions to fill data gaps and reduce the complexity of calculations. It does not provide a formal risk assessment or describe a specific level of risk.
RSEI can be used to:
- Examine risk-related trends over time and across sectors and locations,
- Rank and prioritize chemicals, industry sectors, and locations for strategic planning,
- Support community-based projects, and
- Highlight situations that may lead to potential chronic human health risks.
RSEI results are provided in a downloadable MS Access-based application called EasyRSEI. Users do not need to have MS Access installed to use the application. Expert users can also download the RSEI Queries database, which provides direct access to the data for more complex data applications.
Quickly analyze and compare large amounts of data
You can save resources by conducting preliminary analyses with RSEI because it uses simplified risk factors, such as the amount of releases of toxic chemicals and their degree of toxicity, to quickly evaluate and organize large amounts of data.
RSEI incorporates 25 years of TRI release data, three U.S. Censuses, toxicity and physical properties for more than 400 chemicals, and geographical information for more than 50,000 facilities and thousands of streams and other waterbodies. All of this information is used to model each chemical release’s route through the environment, and any potential human exposure that may result.
Read how RSEI works in more detail.
Questions RSEI can answer
- Which TRI-reporting industry sectors rank highest in potential risk to human health?
- In a specific industry sector, which chemicals pose the greatest potential risk to human health?
- In a specific geographic area or industry sector, which kinds of releases pose the greatest potential risk (e.g. fugitive air releases, stack air releases, releases to water, etc.)?
- What states or regions have the greatest potential risk from certain chemicals or industry sectors?
- What is the trend in potential risk for particular chemicals, industry sectors, or regions?
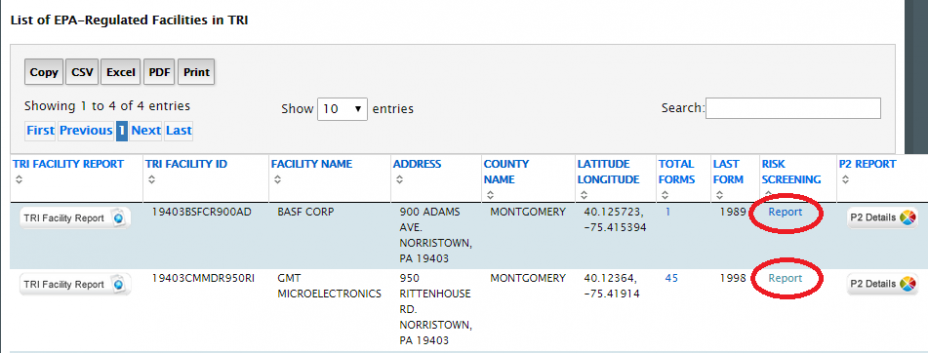
RSEI Facility-Specific Reports Available from Envirofacts
Facility-specific RSEI reports are available as part of the Toxic Release Inventory (TRI) view of Envirofacts. Once you have done a TRI search, on the Search Results page, click on the “Report” link in the “Risk Screening” column for that facility.