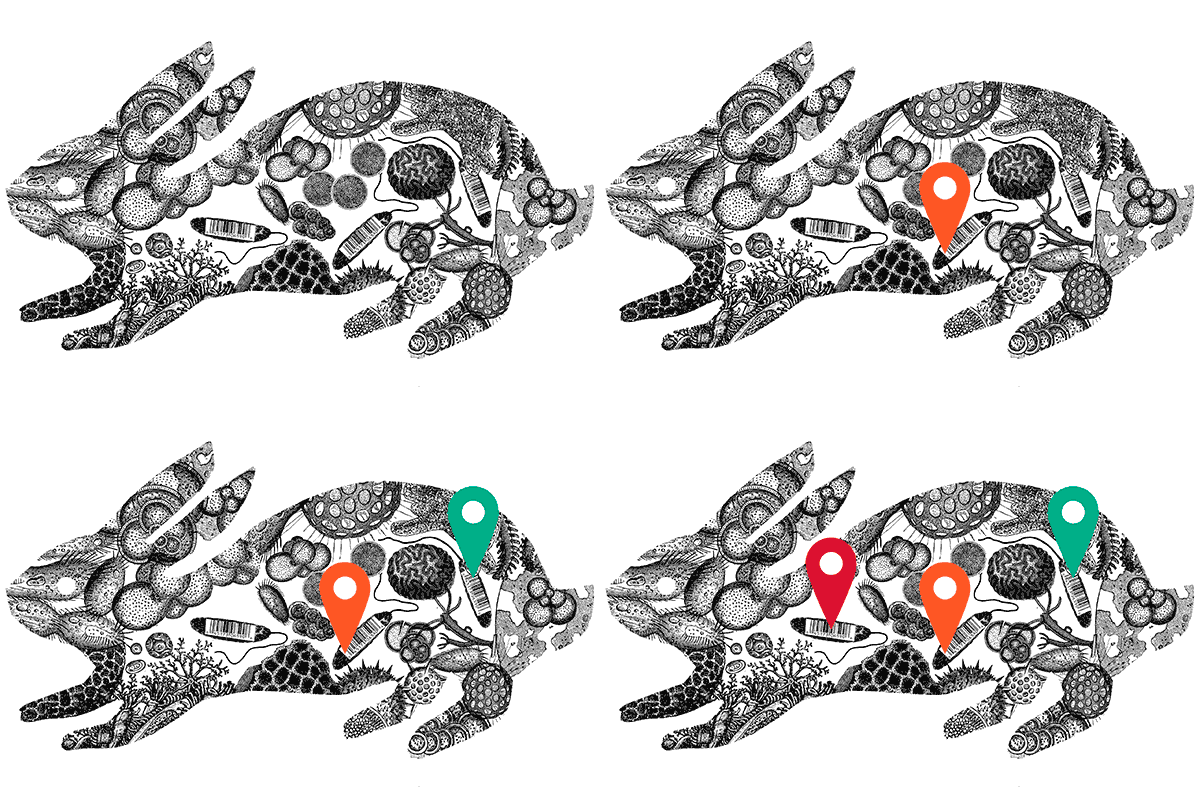
For the bacteria that cause cholera, the journey through a host’s gut is no picnic. The first stop is the stomach, filled with gastric juices so deadly that the vast majority of Vibrio cholerae bacteria won’t make it out alive. Survivors burrow into the wall of the small intestine, hoping to avoid the tide of digested food rushing by. The lucky ones will reproduce; the less fortunate will be attacked by the immune system or, in some cases, killed by antibiotics.
These ebbs and flows in population size have long fascinated biologists, who can use the information both to garner clues about the genetic fitness of an organism and to pinpoint the best times to overpower a pathogen.
“From a theoretical perspective, it’s much easier to fight a very small population than a big population,” explains Pia Abel zur Wiesch, a postdoctoral fellow who works with Ted Cohen, an infectious disease expert at Brigham and Women’s Hospital in Boston. “If you have an antibiotic or vaccine acting when the population is especially vulnerable and small, you have a much higher chance of success because it’s easier to eliminate a few bacteria than a lot of them.”
But how can researchers track a population of microscopic bacteria inside an animal’s gut? Zur Wiesch and her husband, Sören Abel, also an infectious disease postdoctoral researcher, were pondering this question at dinner one night, shortly after he joined the lab of HHMI Investigator Matthew Waldor, also at Brigham and Women’s Hospital. The two postdocs decided to combine her mathematical expertise with his microbial knowledge to answer the question. Their solution involved coupling 500 DNA barcodes with a 50-year-old mathematical formula to produce a technique that can track the ups and downs of pretty much any cell population – pathogen or otherwise.
The technique is called STAMP, for “sequence tag-based analysis of microbial populations.” It’s a two-part procedure that boils down to tacking a kind of barcode onto bacteria and then tracking the barcode frequency to calculate the size of a founding population.
The barcodes are short stretches of DNA that help the scientists distinguish one bacterial cell from another. “The labels are just like last names,” says zur Wiesch. “They don’t really change anything about the individuals. If you think about a few people founding a village, for example, and you just follow their last names, you can infer how many people there were to begin with.”
To deduce the size of the founding population from the barcodes, zur Wiesch made use of a mathematical equation established nearly a half-century ago. In 1971, geneticists Costas Krimbas and Spyros Tsakas showed that it was possible to use markers to infer the size of a population at two different time points. Krimbas and Tsakas used their equation to follow the effects of an insecticide on the population dynamics of fruit flies that fed on treated olive trees.
In a similar fashion, Abel, zur Wiesch, and their colleagues used STAMP to trace the growth and decline of V. cholerae infection in rabbits. Abel added about 500 different barcodes to the genomes of a batch of V. cholerae. He infected rabbits with the labeled bacteria and then collected samples from the animals’ guts at various time points. New deep DNA sequencing technology allowed him to determine how many of each type of tagged bacteria were in the samples.
With those numbers in hand, the researchers used Krimbas and Tsakas’s equation to trace the population dynamics of the tagged V. cholerae bacteria. They compared the relative abundance of the tags in the injected bacteria to the numbers in the different intestinal samples. A sample with a large change in tag frequencies most likely experienced a bottleneck – some event that drastically reduced the population size and, in the process, altered the distribution of tags. Conversely, a sample with a smaller change in tag frequencies probably went through a more benign pathway that had a minimal effect on the bacteria, resulting in a population very similar to the one that had initially infected the rabbits.
The calculations yielded some surprising information about the bacteria’s journey through the gut. “Frankly, when we applied STAMP to Vibrio cholerae in rabbits, we thought it would be kind of a boring experiment,” says Waldor. “We thought the pattern of bacterial migration from the stomach to the anus would be a foregone conclusion. But that’s not how it turned out.” Instead, the team discovered that, after a certain point in the infection, the bacteria changed direction, going up the intestinal tract instead of heading down.
“We couldn’t have figured that out with any other method, because we wouldn’t have known the identity of the bugs,” says Waldor. Though the scientists aren’t sure why the V. cholerae reversed course, they’re investigating a few ideas.
The researchers’ technique, published in the March 2015 issue of Nature Methods, isn’t limited to bacteria, according to Waldor. “STAMP is applicable, in principle, not only to all pathogens – bacteria, viruses, and parasites – but also to commensal organisms and even to eukaryotic cells,” he says. “For example, you could use this in cancer metastasis studies, to determine how many cancer cells metastasize to a new site.”
The importance of the method, says Waldor, is that it enables scientists, in a retrospective fashion, to figure out how many cells or bacteria were the founders of a particular population and to infer where bottlenecks occur. This is good news for humans, but bad news for V. cholerae and other pathogens, now that scientists can pinpoint when they’re most vulnerable.


