Carbon Capture and Sequestration

Adsorption and membrane processes are investigated for carbon capture applications. Breakthrough and isotherm experiments are carried out on carbon-based sorbents to investigate the kinetics and material capacities. Simulations using Grand Canonical Monte Carlo are carried out to assist in sorbent design (pore structure and chemistry). Similar models are used to investigate gas (CO2, methane, water) transport in nanoporous systems of coal and gas shale rocks. Nitrogen-selective membrane technology is also investigated for carbon capture.

Topic 1. Breakthrough Experiments
Flue gas is produced by combusting methane in a slightly O2 enriched feed in a burner at 1000 °C. The high-temperature burner is used to ensure complete combustion of CH4. Assuming a feed of 8% CH4 in air, the resulting flue gas is 8% CO2, 16% H2O, 3.3% O2 with the remainder N2. The flue gas composition can be readily altered by changing the
Figure 1. Experimental apparatus for combustion flue gas breakthrough experiments.
CH4 feed. In this way lower H2O and higher CO2 compositions may be investigated for linking directly to coal-fired flue gas emissions. A range of flue gas conditions spanning natural gas to various-ranked coals are investigated. The flue gas can also be doped with common acid gas pollutants present such as SO2, NOx and Cl2. The packed-bed reactor is a vertical quartz tube with an inner diameter of approximately 5 mm as pictured in Figure 1. Sorbents are held on a quartz filter, which is supported by a quartz frit permanently attached to the reactor tube. The sample size is between 10 and 60 mg, which correspond to bed heights of 1 mm and 5 mm, respectively. Pressure drop across the bed is dependent on the characteristics of both the flow and the sorbent material, but are negligible for our bench-scale set-up.

The reactor may be heated using controlled tube furnace, creating the ability to perform temperature swing adsorption (TSA) experiments and test the capacity and attrition rate of the sample over multiple cycles, as well as determine the heat of regeneration. The CO2 uptake (and release) are measured using a custom-built Extrel quadropole mass spectrometer (MS). The MS is positioned at the outlet of the packed-bed reactor to determine breakthough time.

The CEC lab is also equipped with a Rubotherm microbalance for carrying out adsorption experiments and a Quantachrome instrument to characterize sorbents based on argon, CO2 and N2 adsorption experiments.

Funding Source: GCEP

Topic 2. Gas Sorption Modeling Using Grand Canonical Monte Carlo

The implementation of the GCMC method yields the adsorption isotherms of a given adsorbent-adsorbate interaction in micro- and meso-slit pores: the total and the excess adsorption isotherms are predicted and the effects of pore size and surface functionality investigated. Total adsorption represents the total amount of CO2 adsorbed per unit pore volume, including CO2 in both condensed surface-bound adsorbed phase and weakly surface-bound gas phases. The excess adsorption is the additional amount of CO2 adsorbed per unit pore volume compared with the amount of CO2 in the same volume as the pore without the pore walls. The conversion from total to excess adsorption bridges the molecular simulation results to the direct experiment measurements.
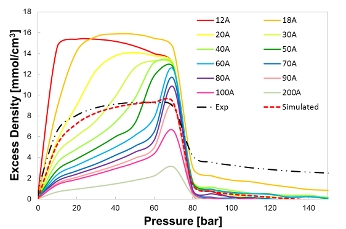
Figure 2 shows a comparison of the simulated adsorption isotherm and the measured adsorption isotherm of the given PSD of a carbon-based sample. The simulated adsorption isotherm is consistent with the lab measurement, especially in the low-pressure region. At high-pressure conditions, the molecular simulation underpredicts adsorption. There are several possible reasons for these discrepancies. The first is due to the fact that the real organic pore structures are more complex than the simplified perfect graphite slit-pore model presented here. In addition, these model predictions do not allow swelling or expansion of the pore walls, which may play a role at high pressure. The high pressure regime is of interest for applying the model to earth systems, such as the organic matrix of coal or kerogen of gas shales.
Figure 2. Comparison of the simulated adsorption isotherm with the experimental measurement at 305 K.
Since functional groups are likely to exist in most carbon systems of interest (e.g., activated carbon, coal, and the organic matrix of gas shale) due to the presence of water vapor and subsequent water-surface interactions (Van Krevelen 1991), adsorption has been investigated as a function of surface chemistry. With insight from the literature, as shown in Figure 3, the graphite surface functional groups of the following types are considered: mono-vacancy (Hashimoto et al., 2004) with dissociated H2O (Kostov et al., 2005); epoxy functionalized (Kudin et al., 2008); hydroxyl functionalized (Kudin et al., 2008; Bagri et al., 2010), carbonyl functionalized (Bagri et al., 2010), carboxyl functionalized, and combined hydroxyl-carbonyl functionalized (Bagri et al., 2010).
Figure 3. Functionalized graphitic surfaces investigated in the current work. These functional groups are positioned in the center of the top layer of the periodic graphite slabs.
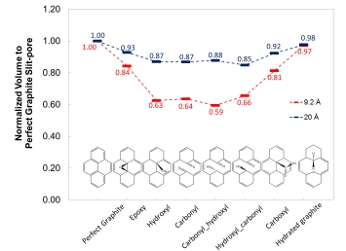
The unit cell volumes of the micropores with the same pore width have been compared. All of the pore volumes have been normalized to the perfect graphite slit pores with the corresponding pore width. For pores approximately 9.2 Å and 20 Å wide, it is important to note that the actual pore volume
Figure 4. Comparison of the pore volumes with different surface functionalities.
varies due to the different geometries of the functional groups present, even though the pore widths themselves are equal. For example, compared to the slit pore with a perfect graphite surface, a hydroxyl functional group embedded in the top layer of the graphite surface in a 9.2 Å pore decreases the volume by approximately 40%. Figure 4 shows a complete comparison of pore volumes with different surface functionalities for both 9.2 Å and 20 Å pores.

Funding Source: BP

Topic 3. Transport Model Predictions using Molecular Dynamics

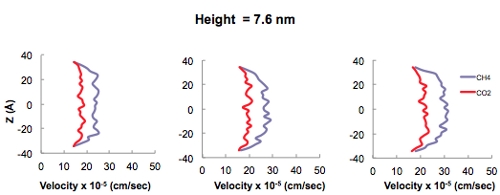
In addition to the adsorption isotherm predictions, transport of CO2 and methane as a function of pore diameter using MD simulations also leads to interesting results associated with gas transport in nanoporous materials. These simulations are carried out in an attempt to determine at which pore size the fluid-wall interactions vs purely fluid-fluid interactions become important in terms of playing a role in the mechanism of fluid transport in systems comprised of nanopores. The Klinkenberg effect is a result of gas slippage along the walls of a pore, in which fluid-wall interactions dominate over fluid-fluid interactions and may occur when the pore diameter approaches the mean free path of the gas. Conveniently, MD simulations are carried out to determine at which pore diameter this effect becomes pronounced. Figure 5 shows the velocity profiles of pure CO2 and CH4 fluids in 1.9, 3.8, and 7.6-nm sized pores. As the pore size increases it is evident that fluid-fluid interactions dominate resulting in the familiar Hagen-Poiseuille flow vs. the plug-flow behavior in smaller pores (i.e., pore diameter of 1.9 nm) where fluid-wall interactions dominate in the Knudsen regime. The transition between these two flow regimes occurs somewhere in the neighborhoof of 4 nm. Therefore, since both micro (i.e., < 2 nm) and mesopores exist in earth systems such as coal and gas shales, a combination of these two transport mechanisms is expected to occur.
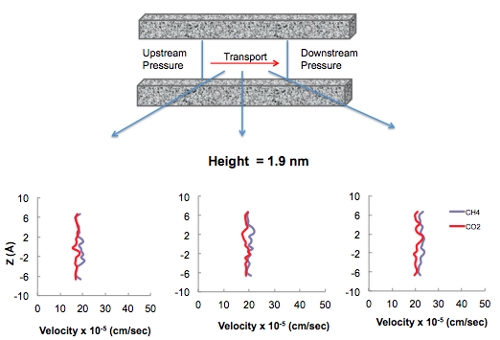
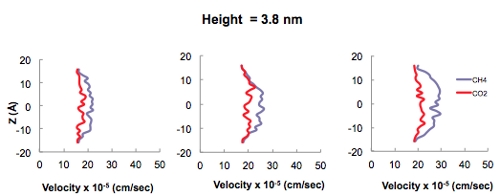
Figure 5. Velocity profiles of pure CO2 and CH4 in 1.9, 3.8, and 7.6 nm sized carbon slit pores exhibiting the relevance of the fluid-wall interactions at smaller pore sizes.

Funding Source: DOE-NETL

Topic 4. Nitrogen-Selective Membranes (Post-combustion capture)

The US has over 300 GW of power capacity from pulverized coal combustion. Reducing emissions from coal will require postcombustion capture technology to retrofit these existing power plants. This capacity, representative of approximately 50% of all power generated in the US is responsible for more than 30% of annual CO2 emissions . Currently amine scrubbing is the technology of choice for postcombustion capture of CO2 due to it being a proven technology for smaller-scale applications of current market production of CO2. This technology comes with its challenges and still has not been proven to be successful on the scale of carbon capture required of the current US coal fleet.

The CO2 concentration in the flue gas of pulverized coal combustion is too small of a driving force to take advantage of a membrane technology for selective CO2 capture. The proposed research aims at applying dense membrane technology to take advantage of the nitrogen (N2) driving force in postcombustion capture.

The membrane housing would ideally be connected directly after the boiler or after the SCR (selective catalytic reduction) catalyst used for NOx reduction if one is in place . Since the NOx reduction process produces additional N2 the membrane technology could be placed after this unit so that the evolved gas is removed.

Under a high partial pressure of N2 (0.77 atm), this stable molecule adsorbs perpendicular to undercoordinated top sites of a ruthenium-coated micron-thick vanadium layer supported on porous stainless steel as depicted in Fig. 6.
Figure 6. Schematic of N-Selective Membrane Reactor
Due to the undercoordination of these tops sites, they are able to donate electron density more easily into adsorbed nitrogen, specifically into the N2 anti-bonding orbitals, which weakens the N2 triple bond leading to its dissociation. These materials are chosen for initial investigation, but other promising candidates such as alloys of V with varying metals and dopants are also investigated. After dissociation of N2 on the surface, atomic N diffuses into the subsurface, hops through the interstitial octahedral (O-site) and tetrahedral (T-site) sites of the V lattice. The N diffusivity in the bcc V bulk is very sensitive to temperature, ranging from 2.79x10⁻¹⁶ cm2/s at 573K to 8.00x10⁻⁶ cm2/s at 2098K. By comparison, the H diffusivity in Pd at 1000K is 5x10⁻⁴ cm2/s, and will serve as a target property for the transport material in the proposed research. Modifying V by alloying and doping with other metals to obtain enhanced diffusion will be a second objective of the proposed investigations. The high temperature present at the exit conditions of the boiler will aid in facilitating the diffusion of atomic nitrogen across the membrane.

Funding Sources: ARO (DURIP); NSF (Catalysis)