You are here

About Our Alumni

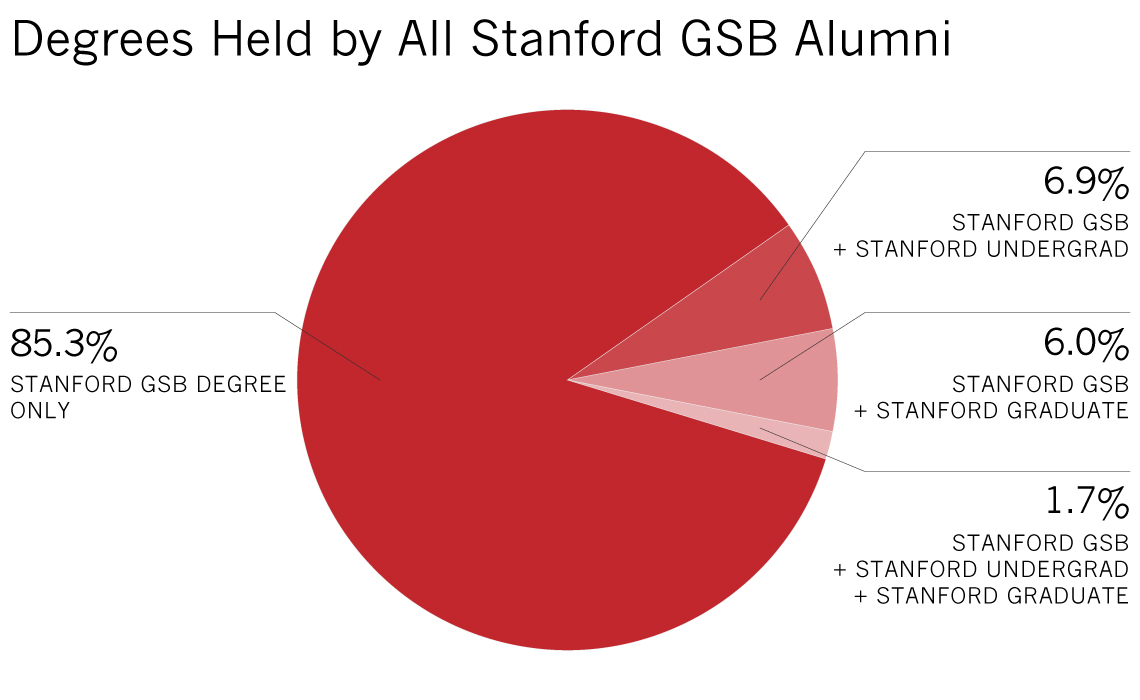
As of September 2015, Stanford GSB has 28,529 living alumni and has awarded a total of 32,583 degrees.

Living Alumni by Program and Degrees Awarded

Program Degrees Awarded Number of
Living Alumni
% of Total
MBA 20,894 18,391 64.5%
PhD 881 822 2.9%
MSx (Sloan) 2,447 2,224 7.8%
SEP 8,361 7,092 24.9%
Total 32,583 28,529 100.0%
Includes all degrees awarded since the school’s founding. A number of our alumni hold multiple Stanford GSB degrees. These individuals are counted once according to the degree hierarchy listed above. The figures include degree and certificate holders, as well as those who were enrolled in a program for three or more quarters but did not graduate.

Reported Geographic Distribution

  Number of Alumni % Alumni
U.S. 19,332 67.8%
  Bay Area 7,694 27.0%
  Elsewhere in the U.S. 11,694 41.0%
Outside U.S. 6,762 23.7%
Unknown Address 2,431 8.5%
Based on addresses of living alumni reported in the Alumni Directory as of September 2015.

Largest Chapters

Chapter Total
Alumni
% of
Total Alumni
Bay Area 7,694 27.0%
New York 1,976 6.9%
Los Angeles 1,164 4.1%
United Kingdom 825 2.9%
Washington DC 765 2.7%
Puget Sound 667 2.3%
Boston 665 2.3%
Japan 613 2.1%
Portland 433 1.5%
Chicago 429

1.5%

Switzerland 425

1.5%

Colorado 404

1.4%

Australia 403

1.4%

France 390

1.4%

San Diego 374

1.3%

Florida 367

1.3%

Dallas/Ft. Worth 351

1.2%

Orange County 348

1.2%

Singapore 345

1.2%

Mexico 343

1.2%

Living MBA Alumni by Gender

Decade Living
Women
% Decade Living
Men
% Decade Total Living
MBA Alumni
1930s 1 14.3% 6 85.7% 7
1940s 9 3.8% 227 96.2% 236
1950s 15 1.6% 911 98.4% 926
1960s 17 0.9% 1,797 99.1% 1,814
1970s 373 12.9% 2,519 87.1% 2,892
1980s 786 25.7% 2,268 74.3% 3,054
1990s 1,003 28.8% 2,476 71.2% 3,479
2000s 1,276 34.7% 2,403 65.3% 3,679
2010s 822 35.7% 1,480 64.3% 2,302
Grand Totals 4,302 23.4% 14,087 76.6% 18,389